Traffic noise control and sustainable urban planning
<<< Back to Urban planning
In this section, we consider a few elements of the relation between sustainable urban planning and traffic noise control. The implications of urban densification strategies, leading to higher population densities and traffic volumes, are addressed. Illustrations for specific cities are presented, in particular for Amsterdam, which is representative of many European cities with a historic center and suburbs developed in the 20th century.
1. Traffic noise in cities
Road traffic noise levels in cities show large spatial variations. The noise levels are high near busy roads and low in shielded areas or areas far from busy roads. Thus, the traffic noise levels are related to the local traffic volumes. The traffic volumes are in turn closely related to the infrastructure of the city, in particular to the road network and the buildings (dwellings, offices, shops, …). Thus, we have a two-stage relation from infrastructure to traffic noise:
- Buildings and road network influence traffic volumes.
- Traffic volumes determine traffic noise levels, in particular traffic noise levels at the houses of the inhabitants.
This is illustrated schematically in Figure 1.
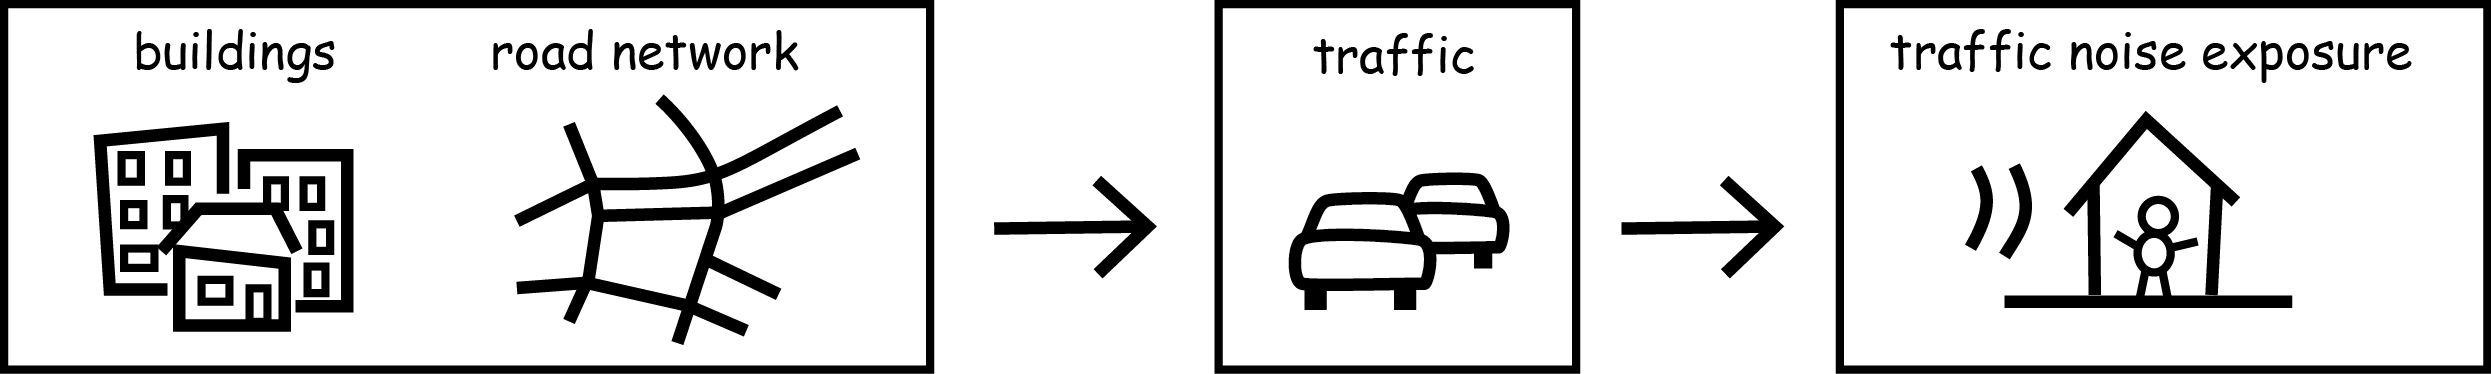
Figure 1. Schematic illustration of the causal chain of traffic noise exposure of inhabitants of a city (at home). Traffic volumes in the city depend on the locations of buildings and on the road network.
The first relation, from infrastructure to traffic volumes, is complex. Traffic volumes in the city depend on the locations of buildings and on the layout of the road network, but there are also other factors of influence. The buildings are usually starting points and/or end points of trips by car on the road network, except for trips of cars that only use the road network for passing through the city. The spatial and temporal distributions of trips on the road network depend on the complex system of travel behavior of people, with many interrelated factors of influence, such as labor market demand, travel times, quality of public transport, bicycle paths, and footpaths.
The second relation, from traffic volumes to traffic noise exposure, is also rather complex. Noise levels at the façade of a dwelling depend on the distances to the roads and on the traffic volumes. Intermediate buildings also play a role: a building may screen or reflect sound waves generated by traffic. Further, the design of building blocks is of interest. In general, closed building blocks lead to lower noise levels at façades that are not exposed directly to traffic noise (quiet façades).
The above considerations imply that there is also a close relation between traffic
noise control and the planning of the city, in particular the planning of new developments
of buildings and roads. In other words, traffic noise control is closely related to urban
planning.
A further implication is that cities should consider noise reduction plans as a part of
broader urban development plans. A city is concerned not only with traffic noise control,
but with a wide range of aspects of urban life and sustainability. Sustainable urban
planning needs to address more than one issue; win-win situations where many interests
are addressed by the same overall plan must be the goal.
2. Sustainable urban development
Sustainable development may be defined as development that optimizes the quality of life of people, including future generations, considering both economic and environmental aspects. This definition is in line with the definition given in 1987 by the Brundtland commission [1].
Sustainable urban development can be seen as sustainable development applied to a
city [1].
Elements of a sustainable city are:
- sustainable economy
- good housing of the inhabitants
- clean environment, low noise and air pollution
- good health of the inhabitants
- sustainable transport system, less automobile use, more non-motorized transport
- efficient land use (compact city).
Most elements are related to each other. For example, public health is affected by noise and air pollution caused by road traffic. Sustainable urban development requires a careful balance between the elements. For example, there may be an optimum situation with a moderate amount of motorized traffic in a city, considering both positive (economic) effects and negative (environmental) effects of motorized traffic.
An important question is: which spatial urban planning strategies are best for urban sustainability? There is an ongoing debate on the answer to this question [1]. Presently, many urban planners believe that urban densification strategies are preferable, and they consider a compact city as a sustainable city. However, there is no consensus about this. To understand the evolution of ideas about sustainable urban planning, it is useful to take a brief look at urban development in Europe in the past century.
3. Development of European cities in the 20th century
The structure of many European cities has been influenced by the ideas of Le Corbusier and coworkers, formulated in the first half of the 20th century. In view of problems in industrial cities at the beginning of the 20th century, Le Corbusier wanted to create better living conditions and a better society. A central idea was that one should separate the four basic functions of a city: housing, work, transport, and leisure. For example, houses should be concentrated in residential quarters and (major) roads should preferably be located far from houses. Le Corbusier was influenced by the book "Garden cities of tomorrow", published by Ebenezer Howard around 1900. The designs of Le Corbusier have been called ‘vertical garden cities’.
An example of the influence of Le Corbusier’s functionalism is the Amsterdam urban plan of 1935 ("Algemeen Uitbreidingsplan van Amsterdam"), with its characteristic garden cities (suburbs) on the west side of the city (see Figure 2). The plan was executed after the Second World War and has resulted in open urban areas in the outer parts of Amsterdam, which differ from the more compact areas in the central part of the city developed in the 15th to 19th century.
In the sixties the new quarter Bijlmermeer was developed, with high-rise apartment buildings separated by green areas (see Figure 3). The green areas were intended for leisure, but unfortunately it turned out that they were considered as unsafe areas by the inhabitants. To counteract a population decrease in the seventies, and to increase the liveliness of the city and the quality of life of the inhabitants, urban development ideas in Amsterdam shifted to the concept of the compact city, i.e. a densely populated city that mixes housing, work, and leisure.
The tendency towards the compact city still exists today. It can be seen as a response to urban sprawl and the creation of suburbs far from the city center. Cities have grown in size considerably over the last century. This has its positive effects (more living space per inhabitant) but it may also have negative effects. People living in suburbs are likely to use motorized transport more often than people in the center do. A compact city may have better environmental qualities than a sprawling city (see section 5), and furthermore may improve economic and social aspects of urban life.
The above considerations focus on the density of a city - for example, building density or population density. The road network is another important element of the structure of a city. This can be seen in Paris, with its long boulevards developed by Haussman in the 19th century. At that time one could not foresee that road traffic would grow as much as it has done over the past decades. The wide boulevards and streets in Paris are still able to contain current large traffic volumes (see Figure 4), but smaller streets in Paris, and many other cities, are less suitable for today’s traffic.
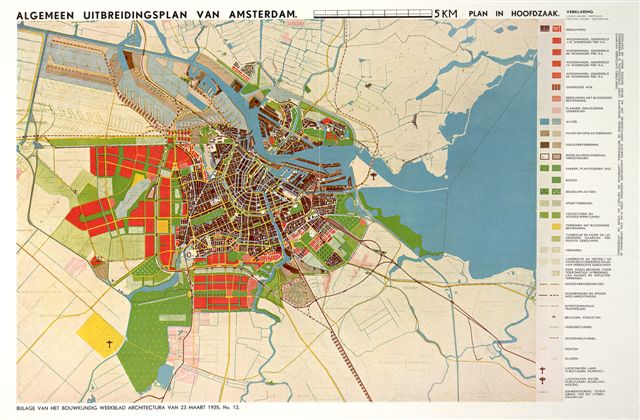
Figure 2. The Amsterdam urban plan of 1935, with its characteristic garden cities (suburbs) shown in orange on the left.
Source: http://commons.wikimedia.org/wiki/File:Algemeen_uitbreidingsplan_amsterdam1935.jpg
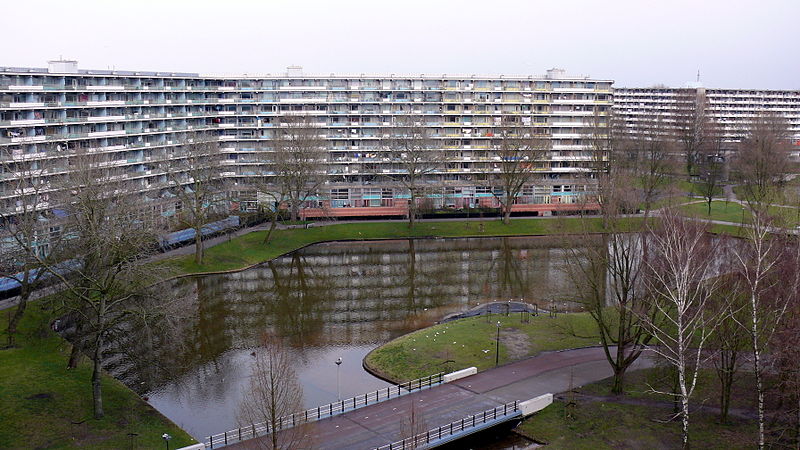
Figure 3. View of the Amsterdam quarter Bijlmermeer built in the 1970s
(picture 2008).
Source: http://commons.wikimedia.org/wiki/File:Gooiord,_Bijlmer.jpg
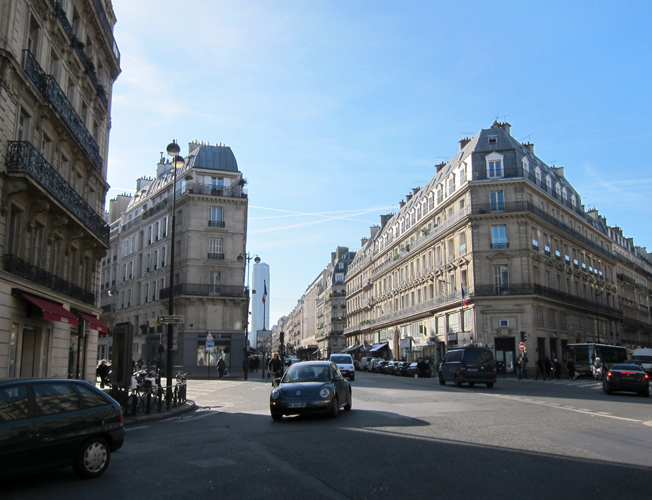
Figure 4. A crossing of wide streets in Paris (rue de Rennes and rue du Four).
4. Urban plans for the next decades
Important questions for cities for the next decades are the following questions.1. Should traffic be reorganized?
- Should motorized traffic in the city center be restricted?
- How?
- How do we achieve a modal shift to sustainable transport modes?
2. What type of spatial urban planning is preferred?
- Sprawl or infill?
- Separation of functions?
- Compact city?
For example, the cities of Amsterdam and Rotterdam address these questions in plans for the next decades [2-6]. Both cities foresee a significant population increase.
The answers to the above questions depend on the local situation. There are no universal answers. In the following sections we present a few general considerations, which may help in the process of finding local answers to the questions, and thereby developing local sustainable urban plans. We first consider spatial urban planning (Section 5) and next traffic planning (Section 6).
5. Spatial urban planning: sprawl or infill?
As described in a previous section, the ideas of urban functionalism were abandoned in the 1970s or 1980s. The reason is that ‘the human side’ of the city had been forgotten by the functionalist movement. This is described by Halbertsma and Ulzen in their book about the cultural history of the European city [7]. After the Second World War, cities became less lively: people worked in the daytime, while at night the cities became ‘ghost cities’. This caused problems in cities that previously flourished, such as Liverpool, Manchester, cities in the Ruhr area, and Bilbao.
In the 1980s there was an increase of creative activities in cities, such as IT, advertising, marketing, and art. ‘Bad’ urban areas were revitalized by the inflow of creative inhabitants. This process is called gentrification. An example is the city of Glasgow, which even became cultural capital of Europe in 1990. Another example is the urban quarter Jordaan in Amsterdam (see figure 5).
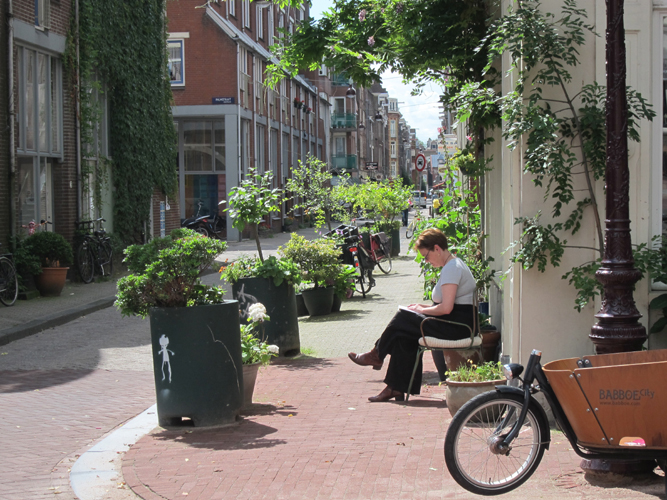
Figure 5. The Amsterdam quarter Jordaan is an example of an urban area that was revitalized by gentrification in the 1980s.
What are the implications of urban sprawl or infill for traffic noise and traffic-related air pollution? Two counteracting effects play a role here:
- effect of automobile use
- effect of the distance between automobiles and people.
In a sprawling city, with suburbs located far from the city center, automobile use
is higher than in a compact city (see Figure 6). Automobile use depends on many factors,
and travel distance is clearly an important one. This is addressed in more detail in the
next section.
In a sprawling city, or in a city developed along the ideas of functionalism, with
major roads located far from houses, average distances between cars and inhabitants
(or dwellings) are generally larger than in a compact city. On the other hand, screening
of traffic noise by buildings is less effective in a sprawling city than in a compact
city.
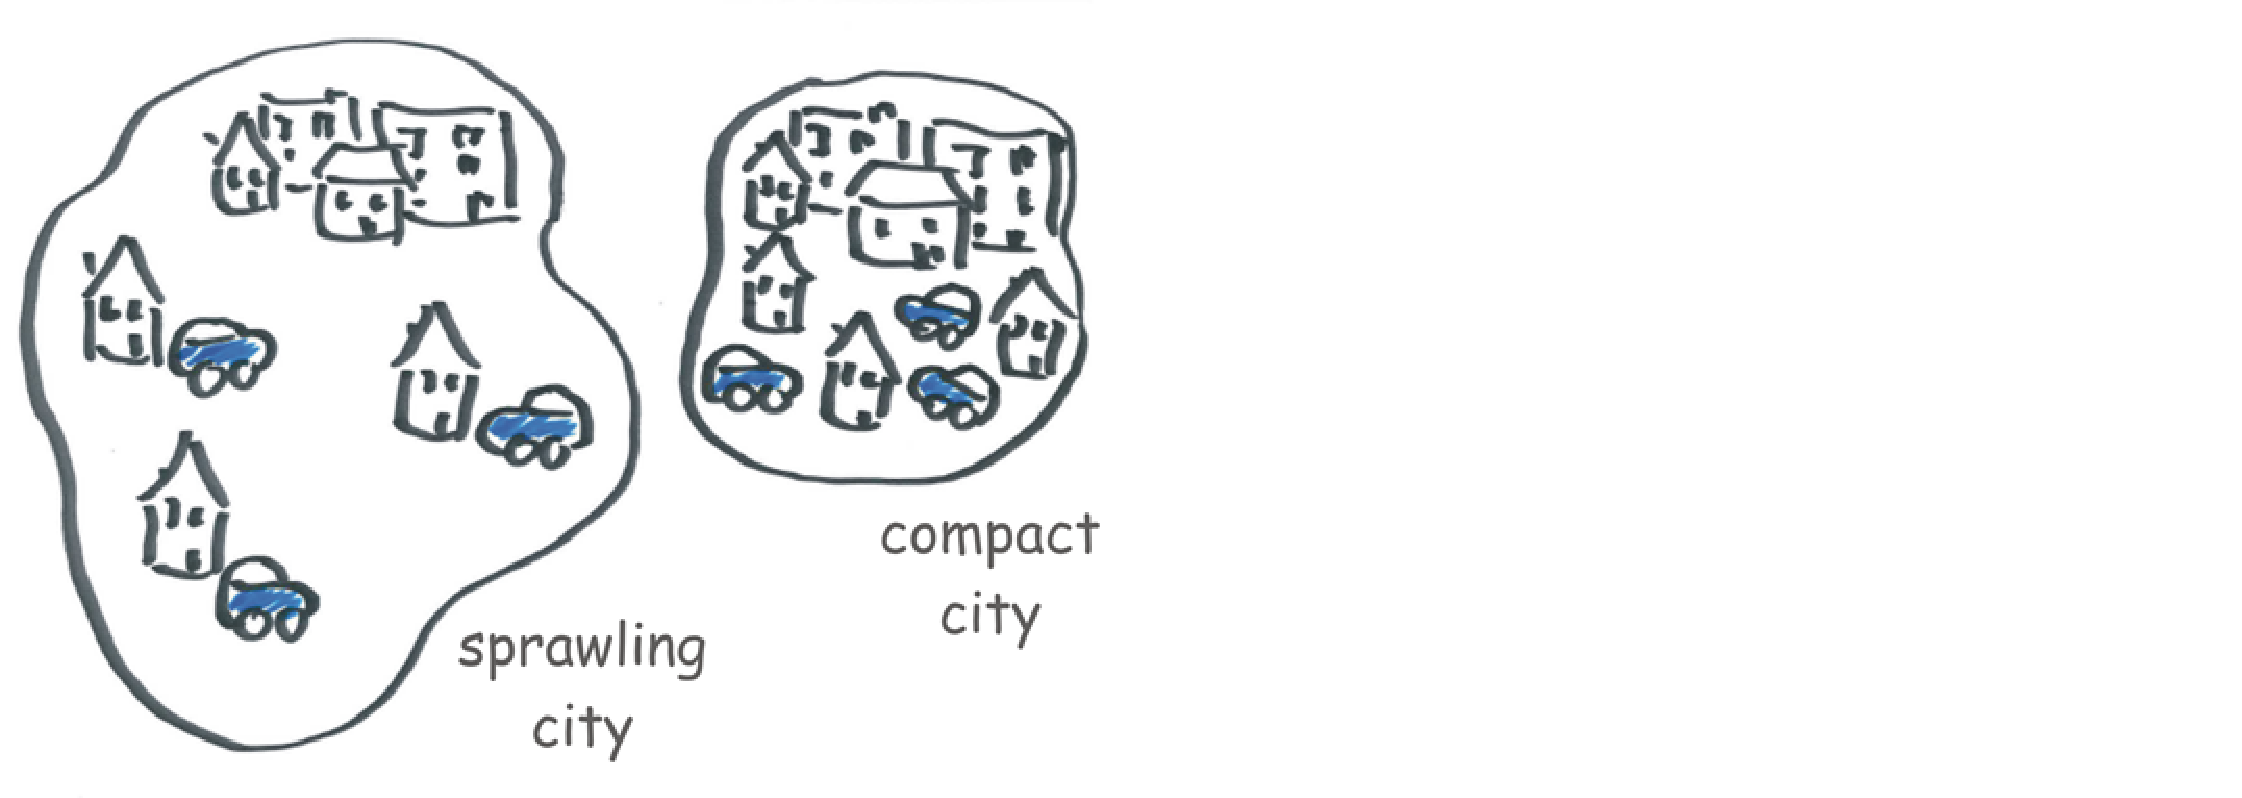
Figure 6. Comparison of a sprawling city and a compact city. Inhabitants of suburbs in a sprawling city use automobiles more often than inhabitants of a compact city do.
Consequently, an increase of urban density may lead to an increase or a decrease of average noise levels and air pollution concentrations. Details of the urban layout, i.e. buildings and road network, play a role. One way to get a better grip on the details is the use of a three-dimensional urban density (Spacematrix), as introduced by Berghauser Pont and Haupt [8]. The three elements of the Spacematrix are
- ground space index (GSI)
- floor space index (FSI)
- road network density (N)
which are defined by the illustrations in Figure 7. In general, a compact city or a compact urban area corresponds to a high value of the floor space index FSI.
In Ref. [9], the relation between the three-dimensional urban density and urban traffic noise is analyzed for the cities of Amsterdam and Rotterdam. It is found that average traffic noise levels (at the most exposed façades of dwellings) decrease slightly with increasing floor space index. This trend is derived by comparing different areas in the cities. The same trend was also found for artificial urban fabrics, taking into account the fact that automobile use per person decreases with increasing floor space index (see Section 6).
The trends for air pollution are in general not identical to the trends for traffic noise. For air pollution the above mentioned counteracting effects also play a role, but dispersion of air pollution and noise propagation are two different physical phenomena. For more information, see for example Ref. [10].
Urban density can also be related to traffic noise levels at the backsides of houses. In general, a compact city is characterized by a high concentration of high buildings (high values of FSI). Figure 8, reproduced from Ref. [9], shows two examples of urban fabrics with FSI of the order of 0.75. Example (a) has closed building blocks, with low traffic noise levels at the inner courtyards shielded from the streets. Example (b) has ‘tower-like’ buildings without inner courtyards.
These observations can be related to the structure of Amsterdam. The central part of the city has many closed building blocks, while the suburbs developed in the 20th century have a more open structure. Consequently, in the city center low traffic noise levels occur in closed courtyards, while high levels occur along busy streets. In the suburbs there are less busy streets close to the houses, so levels on the most-exposed façades are lower here than in the city center. On the other hand, there are less closed courtyards with quiet façades in the suburbs.
This illustrates that urban infill scenarios have the danger of high noise (and air) pollution, in particular if the scenarios do not include a reduction of automobile use per person. Traffic reduction measures (see next section) will help to reduce the high noise levels in a compact city. Furthermore, screening by buildings in a compact city may be exploited to create quiet backsides and quiet areas.
As indicated before, traffic noise control should be considered in the context of sustainable urban development, taking into account a broad range of urban factors. This applies also to the question whether urban planners should go for dense cities with shielded areas and closed courtyards or rather for a city with a more open structure. Traffic noise is only one aspect of shielded areas and closed courtyards. Other aspects are for example public security and social interaction of inhabitants, which may be higher in cities without closed courtyards. The detailed balance of all relevant factors depends on the local situation in a city.
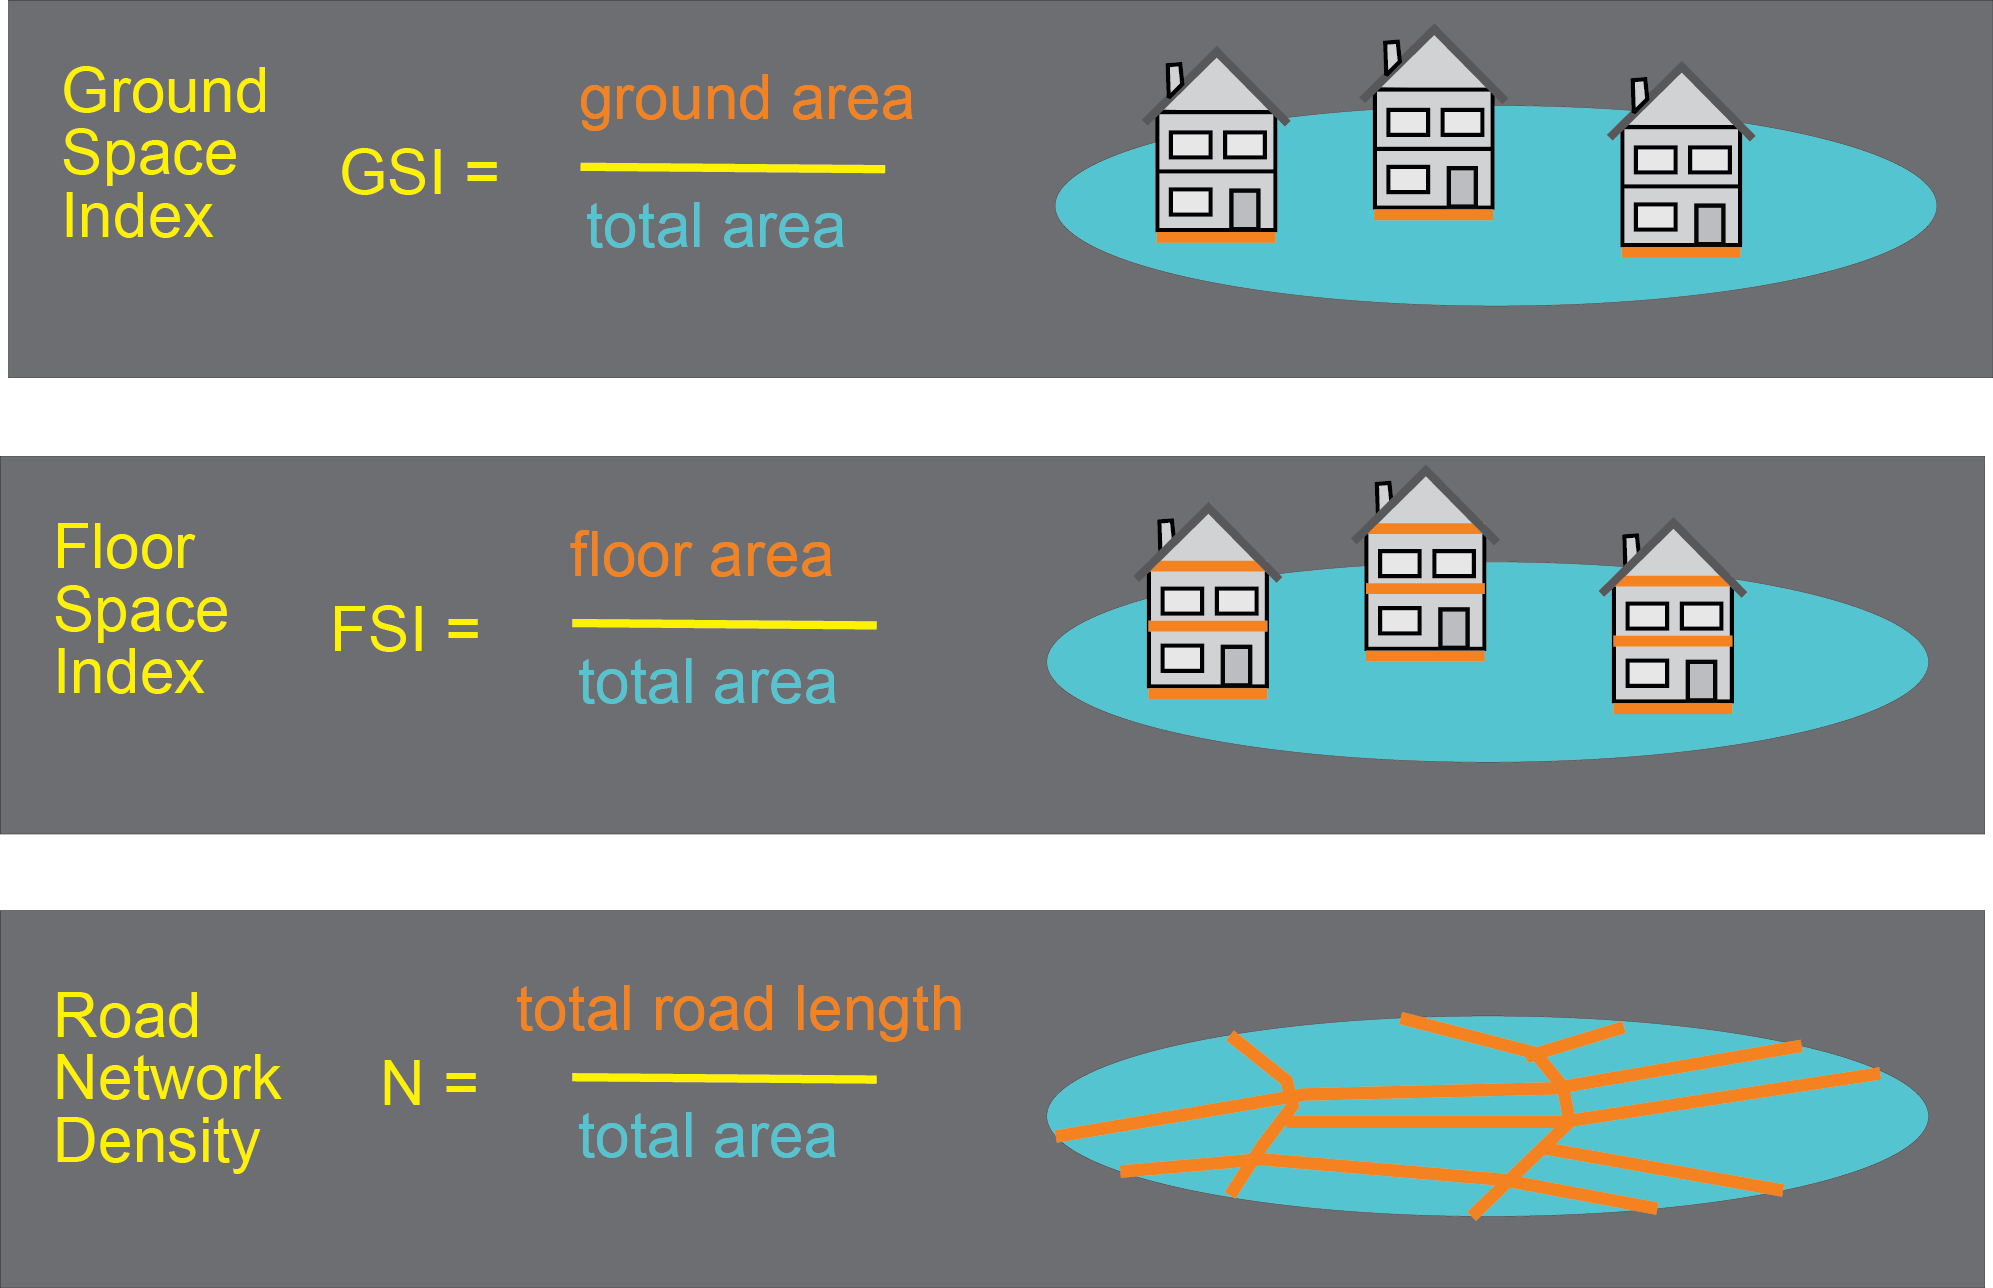
Figure 7. Illustrations of the definitions of GSI, FSI, and N, which are the elements of the three dimensional urban density called Spacematrix.
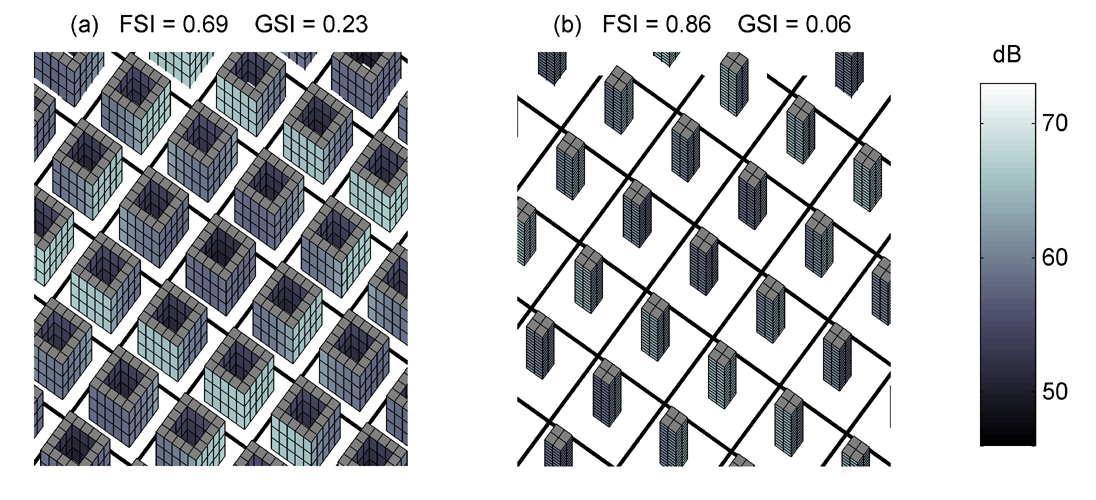
Figure 8. Two examples of urban fabrics with a rectangular grid of streets between building blocks, and traffic noise façade levels represented by a gray scale. Example (a) has blocks with sides of 5 building units and 3 floors. Example (b) has blocks with sides of 2 building units and 15 floors.
6. Traffic planning: think global, act local
6.1 Global analyses
Traffic noise in a city is directly related to the traffic volumes on the road network. The traffic volumes depend on various characteristics of the city, such as
- road network and buildings (dwellings, offices, shops,…), as described in Section 1,
- public transport,
- infrastructure for cyclists and pedestrians.
Travel behavior of the inhabitants (and visitors) also plays a role, which is related to personal parameters such as lifestyle, wealth, or car ownership [11]. Other parameters are also important such as labor market demand and accessibility to city functions such as schools, hospitals, grocery stores and so on.
On a different ‘level’, traffic volumes are related to urban density or population density. For example, automobile use may be low in a compact city or a city center, and higher in a sprawling city or low-density suburbs. Kenworthy and coworkers [12,13] have presented extensive studies of automobile use in a large number of international cities. They concluded that automobile use is more strongly related to urban density than to wealth (represented by gross regional product). Automobile use decreases with increasing urban density, and public transport increases with urban density.
Figure 9 shows results of Newman and Kenworthy [13], illustrating that automobile
use decreases with increasing urban density. Automobile use is high in North-American
sprawling cities and low in more compact Asian cities like Hong Kong. It should be noted
that there have been critical comments on the statistical methods underlying the graph
in Figure 9.
More recently, Marshall [14] performed a similar study of automobile use in US cities.
This study yielded a graph comparable to the graph of Newman and Kenworthy, showing that
automobile use decreases with increasing urban density.
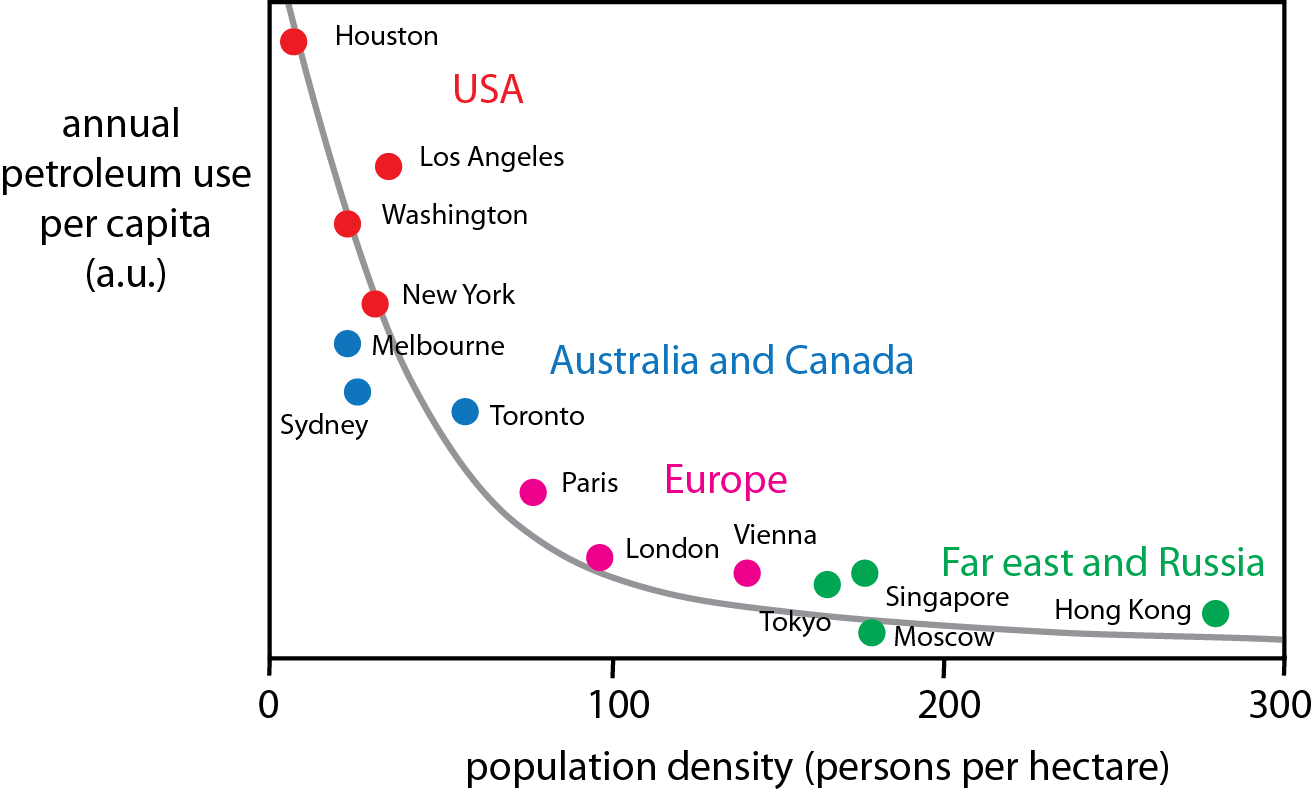
Figure 9. Graph showing the relationship between urban density and
automobile use (expressed as petroleum use), after Newman and Kenworthy [13].
Source: http://en.wikipedia.org/wiki/File:Petrol_use_urban_density.svg
Rather than comparing car use in different cities, one may also compare traffic volumes in different areas within a city, and relate this to local traffic noise levels. This approach was followed in Ref. [9]. The results are relevant for intra-urban analyses of traffic noise distributions within a city. Efficient traffic noise control in a city requires that traffic - or more precisely traffic noise emission - is restricted in the areas where urban density is highest.
6.2 Local action
The above mentioned studies focus on comparisons between different cities, or different areas within a city. The observation that car use is lower in compact cities in Asia than in sprawling cities in the US, for example, does not imply that car use is reduced ‘automatically’ if a European city enhances urban density by an infill scenario. Local action is required to achieve a modal shift from cars to other transport modes.
One way to stimulate people to use bicycles in cities is road sharing on urban roads. This means that the roads are designed in such a way that they can be shared by motorized vehicles, cyclists, and pedestrians. Road sharing requires that the speeds of motorized vehicles be low, say 30 km/h. In other words, road sharing requires traffic calming. This can be achieved by a proper design of the roads, for example, with obstacles on the road.
Actually, the idea of road sharing was introduced in the Netherlands already in the 1970s. The shared roads in the Netherlands still exist, and are called ‘woonerf’ – a word that is also used sometimes in English. Figure 10 shows the traffic sign used to indicate a ‘woonerf’.

Figure 10. Traffic sign used to indicate a "woonerf" in the Netherlands.
Danish architect Jan Gehl is an internationally known promoter of road sharing and protection of pedestrians and cyclists in cities. Videos of his observations on the streets of cities can be found on the internet [15,16]. Many cities in the world have consulted Jan Gehl for advice on urban development plans.
Figure 11 shows an artist impression of a transformation of a busy and noisy street into a street that is more attractive for cyclists and pedestrians. This example was taken from material presented at a meeting on road sharing in Amsterdam in November 2011 [3]. Figure 12 shows an actual example of road sharing, in the third arrondissement in Paris.
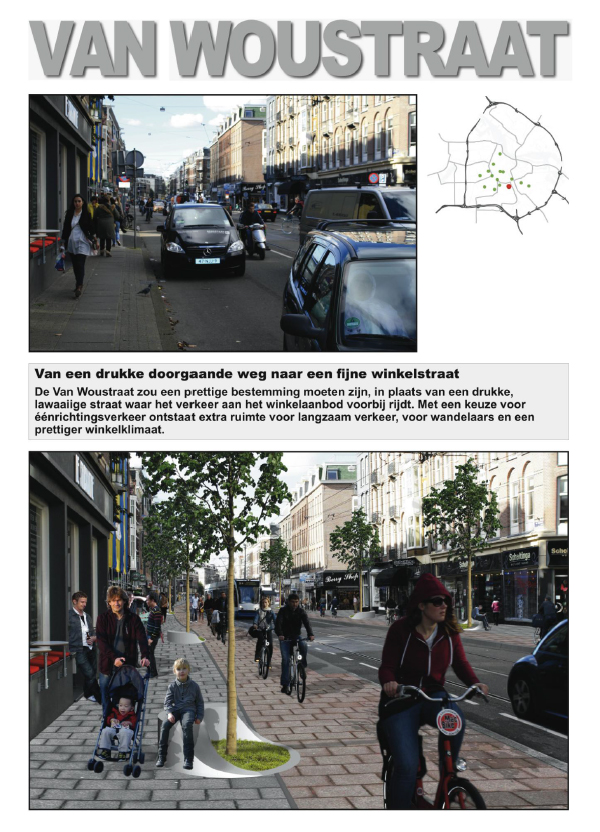
Figure 11. Artist impression of a transformation of a busy and noisy street (top) into a street that is more attractive for cyclists and pedestrians (bottom). Used with permission of the artists [3].
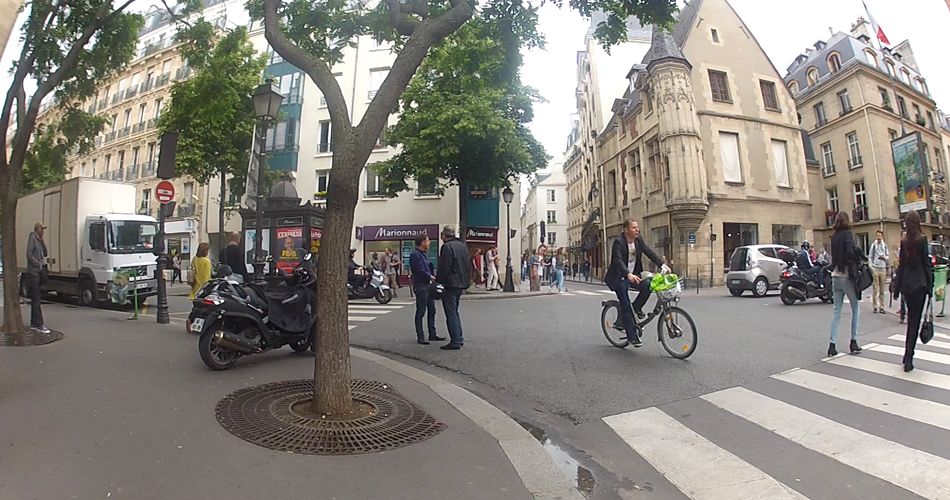
Figure 12. Example of road sharing, in the third arrondissement in Paris. Picture taken by the author, June 2013.
7. Case study: an infill scenario for the center of Rotterdam in 2030
In Reference [6] an analysis is presented of an infill scenario for the center of Rotterdam in the year 2030, corresponding to a population increase from about 30,000 to 60,000 inhabitants. Here we summarize the results of the analysis, since it nicely illustrates the message of this section that traffic noise control should be considered as an important element of urban sustainability plans. The analysis focuses on traffic, environmental pollution, and public health.
Starting point of the analysis was the Rotterdam infill scenario for the year 2030, as described in Refs. [4,5], with 20,000 new dwellings and 30,000 new inhabitants in the central urban quarter ‘Stadscentrum’ of Rotterdam. The buildings with the new dwellings have been designed by urban architects, and are indicated as yellow blocks in the three-dimensional view shown in Figure 13.
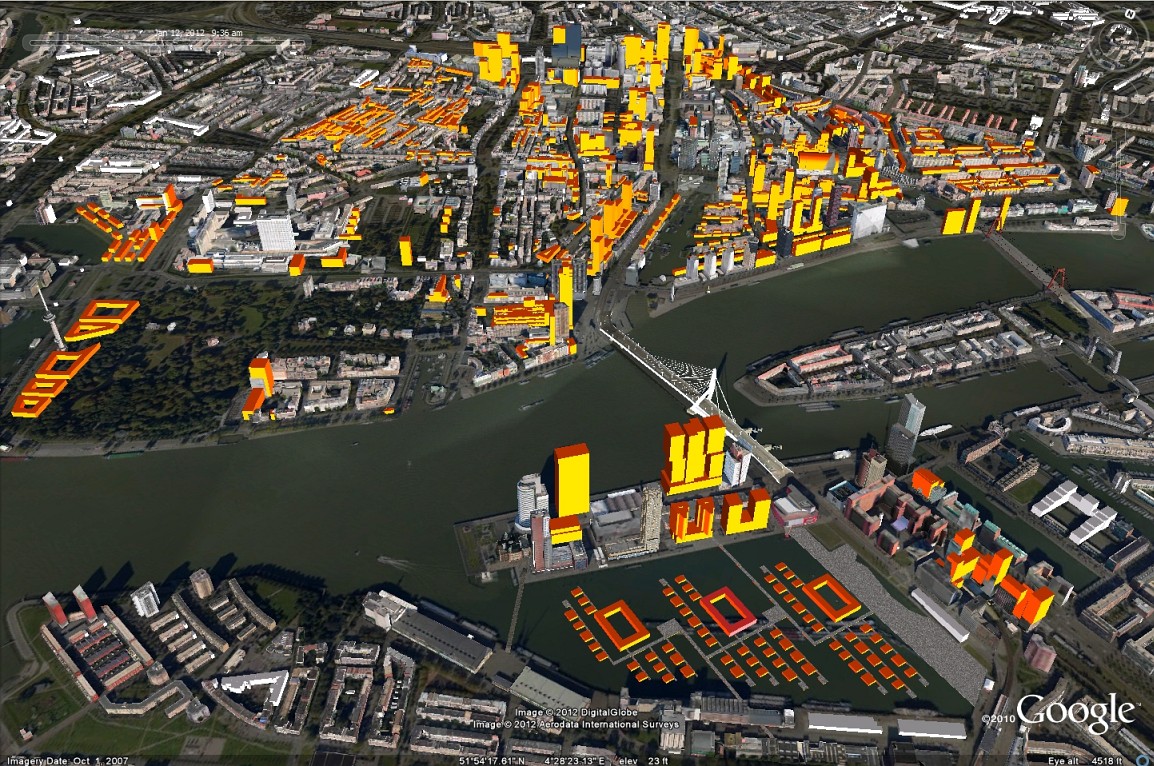
Figure 13. Three-dimensional view of the central area of Rotterdam, with yellow blocks representing new buildings for the infill scenario for the year 2030.
The city of Rotterdam has also developed plans for traffic in the year 2030 [5]. A general objective is that the city center should become (more) attractive and accessible, both for the inhabitants and for visitors. Therefore the following traffic measures have been formulated.
- Modification of major roads – narrower roads, lower speeds.
- Improved infrastructure for bicycles and pedestrians.
- Modifications of parking fees.
- Improved Park and Ride facilities.
The aim of the measures is to achieve a modal shift, i.e. a reduction of automobile use in the city center and an increase of non-motorized transport modes.
In principle, the traffic plans should have been taken into account in the analysis of the infill scenario for Rotterdam in 2030. However, the approach to follow here is not straightforward, since at least three competing effects play a role: i) effects of modal-shift measures, ii) autonomous growth of traffic, and iii) effects of the population increase by 30,000 inhabitants. As a crude approximation, it has been assumed that each new inhabitant generates one additional car trip per day.
The results of the analysis are represented schematically in Figure 14. For details about the results we refer to Ref. [6]. The figure shows that, as a result of the population increase:
- Traffic volumes on the roads increase,
- Urban density increases; in fact this was an objective of the infill scenario, since the ambition of Rotterdam is to achieve a more compact city center,
- Traffic noise and air pollution increase.
The increase of traffic noise levels is relatively small. As a consequence, the increase of the estimated percentage of inhabitants that is highly annoyed by traffic noise (at home) is also relatively small: 7.0% in 2012 and 7.5% in 2030. However, since the number of inhabitants doubles, the increase of the absolute number of highly-annoyed inhabitants is large: about 2300 inhabitants in 2012 and 4600 inhabitants in 2030. The latter number of 4600 highly-annoyed inhabitants has been converted into a health effect expressed in (healthy) life years lost, using a calculation scheme recommended by the World Health Organization. The scheme gives 0.02 life years lost per highly annoyed person (per year), so we find that 4600 highly-annoyed inhabitants correspond to about 100 healthy life years lost (per year).
This negative health effect may be used as an argument for (further) reducing motorized traffic in the city center. In fact the traffic reduction measures described before are in line with this argument. A modal shift from car to non-motorized transport modes will have positive effects on congestion, traffic safety, traffic noise, and air pollution.
A modal shift from car to bicycle will have another positive effect on public health: enhanced physical activity improves the health of the inhabitants. Cyclists are physically more active than car drivers. Using a mathematical technique called Life Table analysis, based on age-specific mortality rates of a population, it was estimated that the modal shift from car to bicycle in Rotterdam in 2030 corresponds to a health gain of 200 life years gained (per year). Here it has been assumed that 10% of the 60,000 inhabitants of the Rotterdam city center in 2030 make the shift from car to bicycle, for short trips (15 km at most) on a daily basis, for example for commuting or shopping.
Finally we mention another positive effect on public health. The Rotterdam infill scenario not only includes measures for promoting cycling in the city center, but also measures aiming for a city center that is more attractive for pedestrians. Improved public space in the city center will have positive health effects through enhanced physical activity of pedestrians. However, these effects have not been quantified in this analysis.
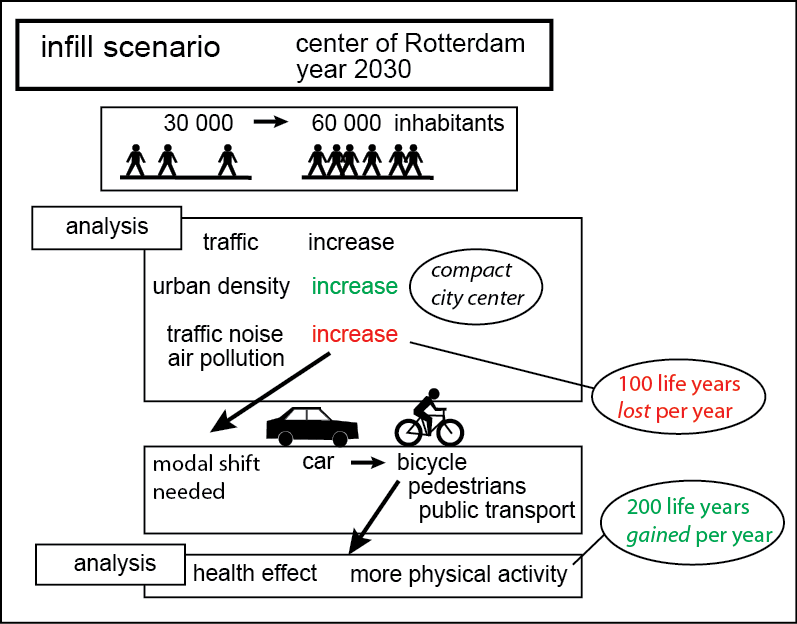
Figure 14. Schematic illustration of the results of an analysis of various elements of an infill scenario for the city center of Rotterdam in 2030, based on an urban sustainability plan aiming at an attractive and accessible city center [4,5]. Increased traffic noise annoyance in 2030 is expressed as a health effect of 100 life years lost per year. This effect can be reduced by modal-shift traffic measures, which in addition has a positive health effect of 200 life years gained per year due to enhanced physical activity of cyclists compared to car drivers.
References
- 1. S.M. Wheeler and T. Beatley. "The sustainable urban development reader" (2nd ed.), pp. 1–392. London, Routledge, 2009.
- 2. "Structuurvisie Amsterdam 2040, Economisch sterk en duurzaam," (Structure vision Amsterdam 2040, Economical strong and sustainable), 17 Feb 2011, Municipality of Amsterdam, in Dutch. URL: http://www.amsterdam.nl/wonen-leefomgeving/structuurvisie/.
- 3. "Ruimte durven delen," exposition and discussion on road sharing in Amsterdam, organized by GroenLinks, 8-20 Nov 2011, ARCAM Amsterdam. The note "Ruimte durven delen" by F. Molenaar, P. van Grieken, F. Kramer, M. Vermeulen, and B. Gerrits can be downloaded from http://amsterdam.groenlinks.nl/node/73926.
- 4. "Programma Duurzaam," (Program Sustainable), urban development plan published by the city of Rotterdam, 2011, in Dutch. URL: http://www.rotterdam.nl/
- 5. "Citylounge bereikt. Een bereikbare en aantrekkelijke binnenstad," (Citylounge accessed. An accessible and attractive city center), traffic plan for the city of Rotterdam, published by the transport department dS+V of Rotterdam, 2009, in Dutch. URL: http://www.rotterdam.nl/
- 6. S. Schaminée, E. Rietveld, E. Salomons, Y. de Kluizenaar, J. Borsboom, H. Borst, and M. Guit, "Analysis of an infill scenario for Rotterdam. Traffic noise, air pollution, and public health in relation to urban density and traffic of cars and bicycles." Internoise 2012, August 19-22, New York City, USA.
- 7. M. Halbertsma, P. van Ulzen, "Steden vroeger en nu. Een inleiding in de cultuurgeschiedenis van de Europese stad" (in Dutch, "Cities in the past and the presence. An introduction into the cultural history of the European city). Coutinho, Bussum, 2008, Chapters 8 and 9."
- 8. M. Berghauser Pont and P. Haupt. "Spacematrix: Space, density and urban form". Rotterdam, NAi Publishers, 2010.
- 9. E.M. Salomons and M.Y. Berghauser Pont, "Urban traffic noise and the relation to urban density, form, and traffic elasticity", Landscape and Urban Planning 108 (2012) 2-16.
- 10. J.D. Marshall, T.E. McKone, E. Deakin, and W. Nazaroff, Inhalation of motor vehicle emissions: Effects of urban population and land area. Atmospheric Environment, 39 (2005) 283–295.
- 11. D.A. Badoe and E.J. Miller. "Transportation–land-use interaction: Empirical findings in North America, and their implications for modeling". Transportation Research Part D, 5 (2000) 35–263
- 12. J.R. Kenworthy and F.B. Laube. "Patterns of automobile dependence in cities: An international overview of key physical and economic dimensions with some implications for urban policy". Transportation Research Part A, 33 (1999) 691–723.
- 13. P. Newman and J.R. Kenworthy. "Gasoline consumption and cities: a comparison of US cities with a global survey", Journal of the American Planning Association, 1989.
- 14. J.D. Marshall, "Energy-efficient urban form", May 1, 2008 / Environmental Science & Technology. http://personal.ce.umn.edu/~marshall/Marshall_14.pdf
- 15. Links to videos of/about Jan Gehl:
http://www.youtube.com/watch?feature=player_detailpage&v=dauJhq7dXMI
http://www.youtube.com/watch?v=rstEWMD89L8&feature=player_detailpage
http://www.youtube.com/watch?v=DMgEsUbMHSQ&feature=player_detailpage - 16. "Contested streets", an exploration of the history and culture of New York City streets from pre-automobile times to the present. See: http://www.contestedstreets.org/