Noise and quietness in cities
Protection of quiet places is supported by the European Environmental Noise Directive.Two types of quiet places are distinguished here: quiet façades and quiet areas.
Quiet areas include not only parks but also quiet residential areas.
It is recommended to keep traffic noise levels in quiet areas below 45-55 dB, and traffic noise levels at quiet façades below 45-50 dB.
Noise is an inevitable element of modern cities. Sources of noise are cars, trucks, airplanes, construction equipment, for example.
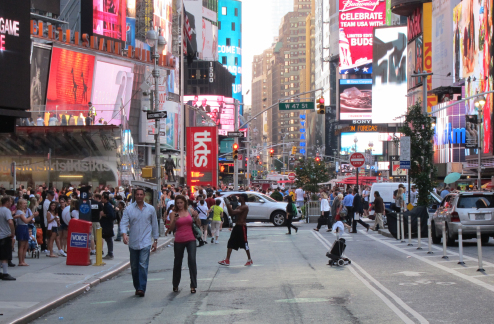
Figure 1. Busy city center (Times Square in New York).
Noise cause annoyance and sleep disturbance of people living in cities. Therefore cities should restrict excessive noise, in particular at locations where people live and spend most of their time. Cities should also have quiet places, where people can relax and recover from the noisy city life.
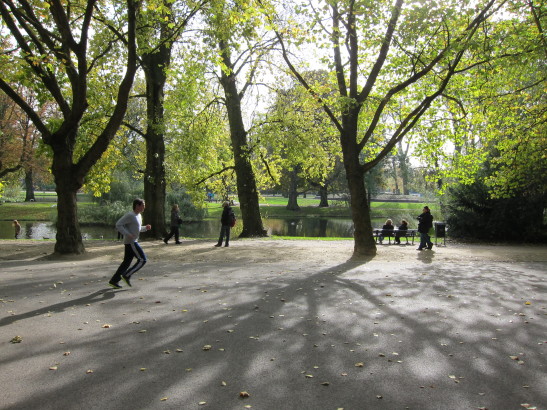
Figure 2. Park in Amsterdam (Vondelpark).
The obvious and most important location for a quiet place is: home!
But: many people in cities live in dwellings near busy roads, so there is also traffic noise at home. For these people it may be good if the dwelling has at least one quiet side (quiet façade), where they can sit in the garden or on a balcony. Sleep disturbance is lower if the bedroom is on the quiet side. Another possibility is to have a quiet area such as a park in the neighborhood of the dwelling, although a quiet dwelling is more important than a quiet area near the dwelling.
When is a place a quiet place? The simple answer is: if there is not too much noise. But: an attractive quiet place should also have other qualities, for example nice vegetation or beautiful buildings. Also positive sounds may help, for example sounds of birds in a park.
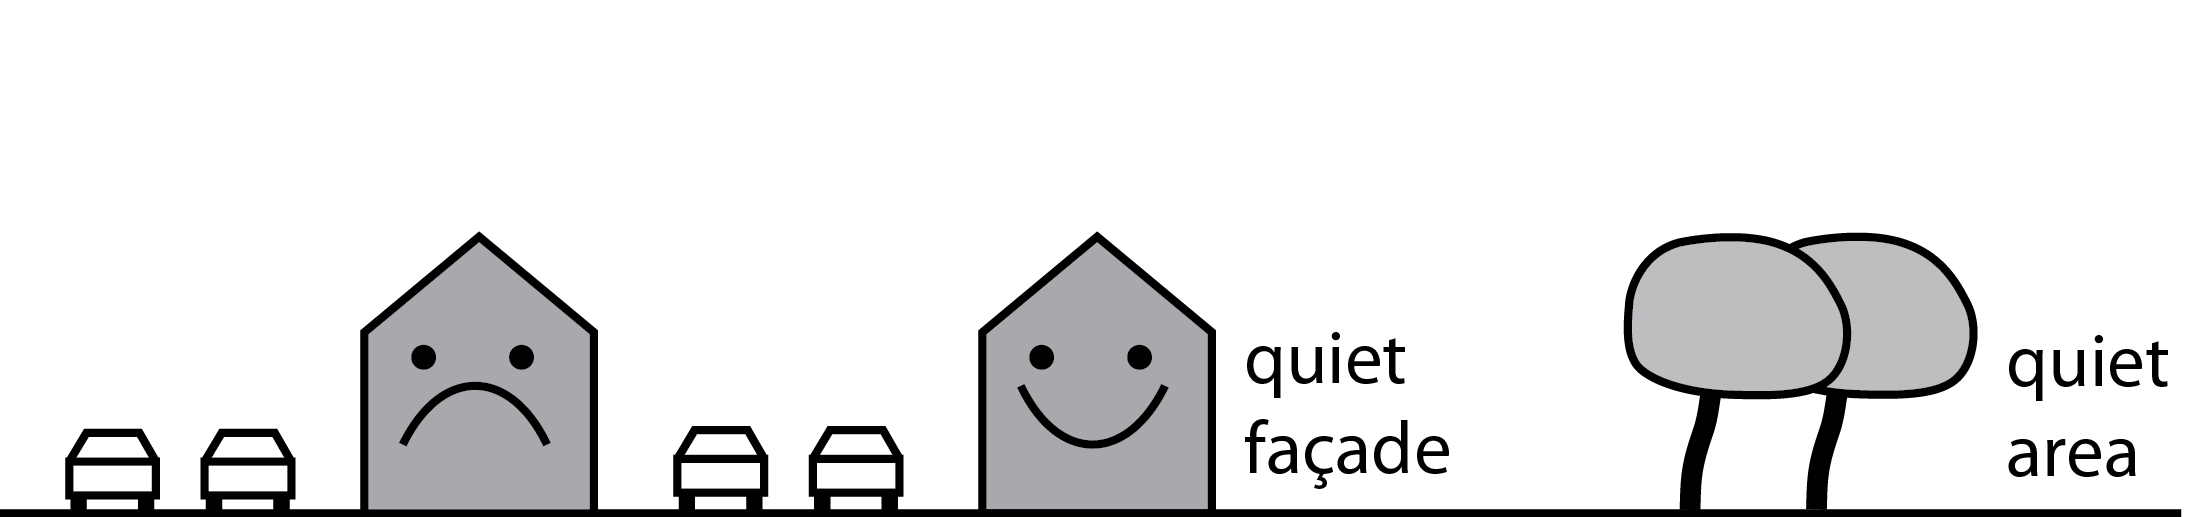
Figure 3. Quiet façades and quiet areas are good for inhabitants.
The aim of this website is to help cities with the creation and
protection of quiet places. The focus is on road traffic noise, which
is the most important outdoor source of noise. For example, a city may
protect a quiet place by restricting traffic in the area. Other types
of noise, such as noise from neighbors or noise from bars and
restaurants, are not considered here.
Effects of road traffic noise
Road traffic noise has serious effects on people. The most important effects are annoyance and disturbance of daily activities such as communication, relaxation, and sleep. Sleep disturbance is particularly serious since undisturbed sleep is important for our physical and mental health. Research has shown that road traffic noise exposure enhances risks of hypertension and heart disease. Typically 10% of a city population is annoyed by road traffic noise. Typically 3% is highly sleep disturbed by road traffic noise. These numbers are estimated from statistical surveys and calculated noise levels at the façades of the dwellings.
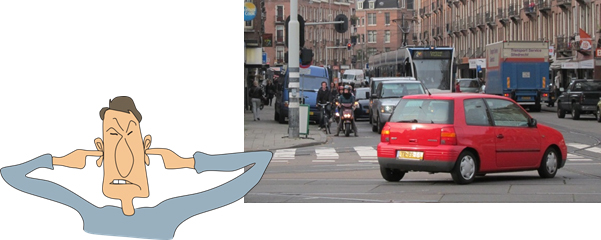
Figure 4. Traffic noise causes annoyance.
Traffic noise control in Europe
The European Union has laid down a strategy for reducing environmental noise exposure and its effects. The strategy includes that major EU cities calculate traffic noise maps and façade noise levels every five years. The EU document ‘Environmental Noise Directive’ describes how the noise maps should be calculated. The calculations take into account the numbers of cars on the roads and the locations of buildings in the city.
As an example, a traffic noise map of Amsterdam is shown in figure 5. High noise levels occur near busy roads. Low noise levels occur in the regions between the roads.
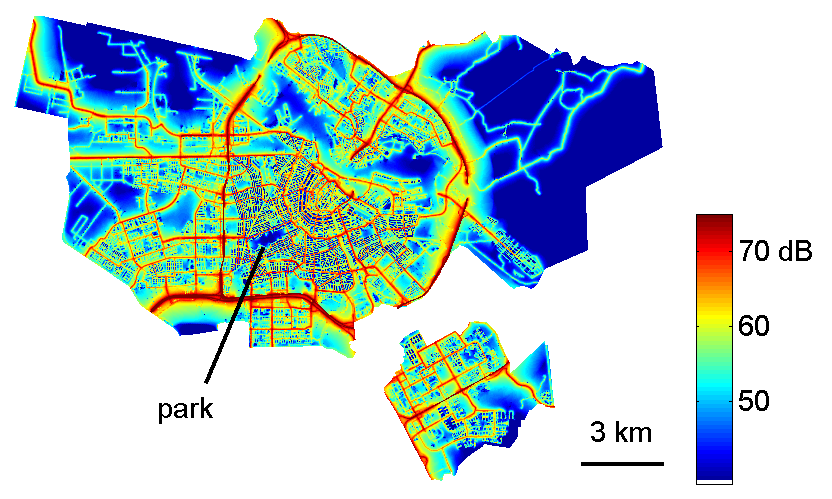
Figure 5. Traffic noise map of Amsterdam. The park of figure 2 is indicated. The color represents the 24h traffic noise level (day-evening-night level). Noise levels in the park are lower than in the area around the park. Note: traffic in quiet streets is often ignored for noise mapping, but here a minimum of 20 cars per hour was assumed.
Based on the noise maps, the cities have to make ‘action plans’. This means that noise levels should be reduced at locations where the levels are high, for example by taking measures that reduce local traffic.
The Environmental Noise Directive also indicates that the cities have to
- estimate the number of inhabitants with a quiet façade at their home,
- protect quiet areas against an increase in noise.
The aim of this website is to help the cities to tackle local noise
problems by taking advantage of the positive effects of quiet
façades and quiet areas.
Quiet façades and quiet areas
Let us take a closer look at quiet façades and quiet areas in cities. Figure 6 shows a part of the traffic noise map of Amsterdam. The map shows high noise levels of 70 dB at the busy streets (orange, red). The map also shows many less noisy streets, with noise levels of 60 dB (yellow). The small grey areas along the streets are dwellings. We see that the dwellings are built here in closed blocks around courtyards. The noise levels in the courtyards are below 50 dB (blue), so much lower than in the streets outside the courtyards. The upper photograph in figure 6 shows a view through the window of a house on a courtyard. At the front of this house there is noise from traffic in the street, while at the back there is quietness. Actually we have both a quiet façade and a quiet area here! Most of the courtyards here are not accessible to the public, but there are a few public courtyards.
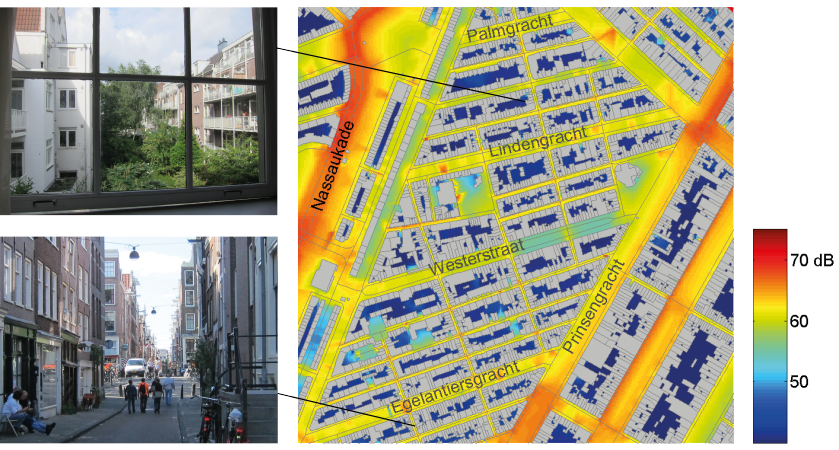
Figure 6. Part of the traffic noise map of Amsterdam from figure 5. There are busy streets (orange), less busy streets (yellow), quiet courtyards (blue) enclosed by houses (grey). The less busy streets, illustrated by the lower photograph, are typical of this lively urban area (Jordaan area). The upper photograph shows a view from a quiet façade on a quiet courtyard.
Types of quiet areas
Figure 7 shows a schematic picture of noisy areas and quiet areas in a city. Traffic noise is loud near busy streets and in noisy quarters. Three types of quiet areas are shown:
- parks
- quiet courtyards
- quiet (residential) quarters.
Large city parks free from motorized traffic are attractive quiet areas. An example is the Amsterdam city park shown in figure 2. Figure 5 shows that the traffic noise level in this park is lower than levels outside the park. In a quiet city park, people may enjoy the peace and quiet, the plants and trees, and other people in the park. A quiet urban quarter may be a historic city center, a lively area such as the Amsterdam area shown in figure 6, or a shopping area free from excessive traffic noise. Quiet quarters have more traffic noise than parks do, but still may be attractive for many people.
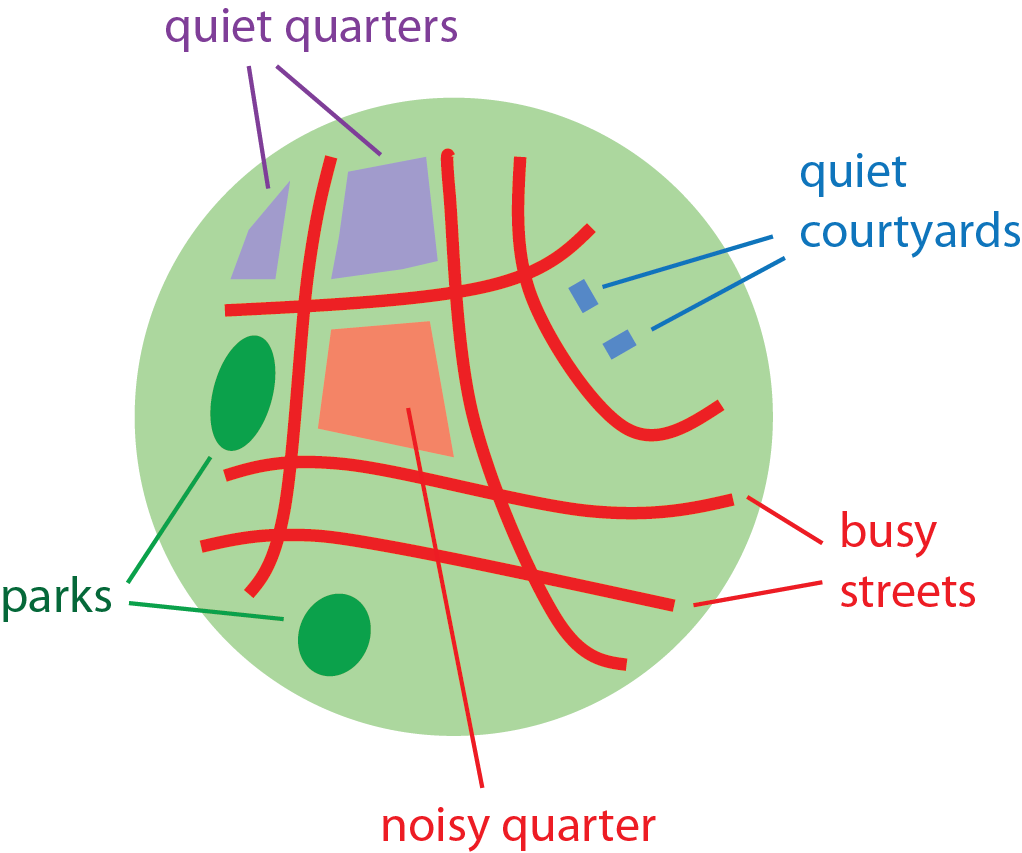
Figure 7. Schematic picture of noisy areas and quiet areas in a city.
Some people like walking in a quiet park.
Some people like reading a book in a quiet courtyard.
Some people like visiting a quiet urban quarter.
In general, an attractive quiet area has two characteristics: (i) low
traffic noise levels, (ii) other qualities such as vegetation or nice
buildings.
Traffic noise levels in quiet areas
What is a reasonable traffic noise level in a quiet area? To answer this question, one may use results of scientific studies into the response of people in quiet areas to traffic noise and other sounds.
First we note that the response of people to traffic noise in a quiet area depends on the type of quiet area. The "acceptance" of traffic noise is lower in a quiet green area outside the city than in a city park, while in a quiet residential area the acceptance may be higher.
In general, annoyance by traffic noise in a quiet area increases with increasing traffic noise level. On the other hand, there are also positive sounds in quiet areas, for example rustling leaves or bird song. Therefore it makes sense to consider the overall appreciation of the acoustic environment (soundscape) in a quiet area. The table below shows typical results that have been found for park visitors. With increasing noise level, the overall appreciation of the acoustic environment decreases.
| Noise level | Percentage of park visitors |
|---|---|
| that consider the acoustic | |
| environment "good" | |
| 50 dB | 70 % |
| 55 dB | 50 % |
| 60 dB | 40 % |
One should be careful about the definition of the noise level here. The levels in the table are total noise levels, including noise from all relevant sources: traffic, people, birds, etc. Traffic noise levels are typically a few decibels lower than total noise levels.
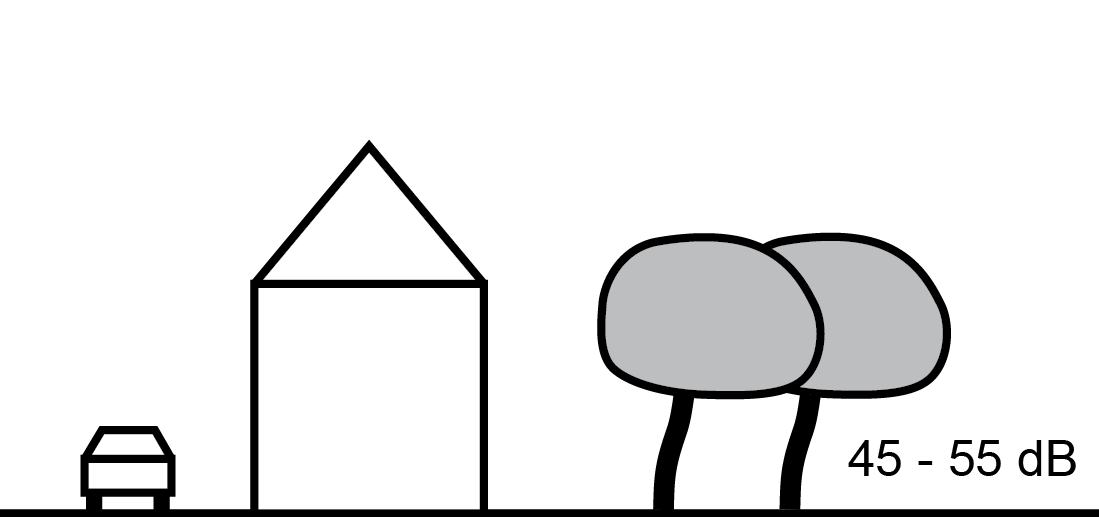
Figure 8. A quiet urban area may be defined as an area where the noise level (day level) is below 45 dB (preferred limit) or below 55 dB (upper limit). Other qualities such as vegetation or nice buildings enhance the attractiveness of the area.
To minimize negative effects from traffic noise in quiet areas, one might adopt an upper traffic noise limit level of 50 dB, or even 45 dB. However, many city parks and ‘quiet’ urban quarters have traffic noise levels between 50 dB and 60 dB. Therefore one may take a more practical viewpoint and use a range of traffic noise limit levels in quiet areas, for example ranging from a preferred value of 45 dB to an upper value of 55 dB. Above the upper value, it is a good idea to consider traffic noise reduction measures, to enhance the attractiveness of the area for recreational and leisure activities.
In scientific studies one also finds that the average annoyance of
people at home is reduced if there is a quiet area near the dwelling,
with traffic noise levels below 50 dB (day level). This effect is
similar to the positive effect of a quiet façade on annoyance
at home.
Traffic noise levels at quiet façades
What is a reasonable traffic noise level at a quiet façade? To answer this question, one may again follow a scientific approach into the response of people to traffic noise, in dwellings with or without a quiet façade.
One finds for example that the average annoyance of people at home is reduced (i.e. lower than average) if the dwelling has a quiet façade with traffic noise levels below 45 dB or 50 dB (day-evening-night level). Further, sleep disturbance is reduced if the bedroom is located on a quiet façade with a noise level below 40 dB (night level).
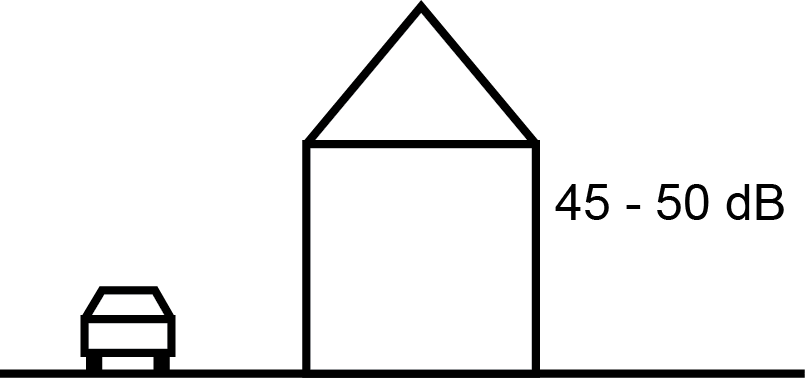
Figure 9. A quiet façade may be defined as a façade where the day-evening-night noise level is below 45 dB (preferred limit) or below 50 dB (upper limit).
There are indications that ‘having a quiet façade’ is roughly equivalent to a decrease by 2 dB of the traffic noise level at the noisy façade (Note: 2 dB is just an indicative figure; for detailed information see Section Human Response). Similarly, ‘not having a quiet façade’ is roughly equivalent to an increase by 2 dB of the traffic noise level at the noisy façade. This implies that average annoyance is lower in dwellings with a quiet façade than in dwellings without a quiet façade, as indicated in the table below.
| Noise level on | Annoyed at home | Annoyed at home |
|---|---|---|
| "noisy" façade | with quiet façade | without quiet façade |
| 50 dB | 9 % | 13 % |
| 55 dB | 15 % | 21 % |
| 60 dB | 22 % | 29 % |
One might adopt a traffic noise limit level of 50 dB, or even 45 dB, for a quiet façade (day-evening-night level). One might also adopt a range of traffic noise limit levels for quiet façades, for example ranging from a preferred value of 45 dB to an upper value of 50 dB. Above 50 dB, the risk increases that traffic noise disturbs daily activities and sleep.
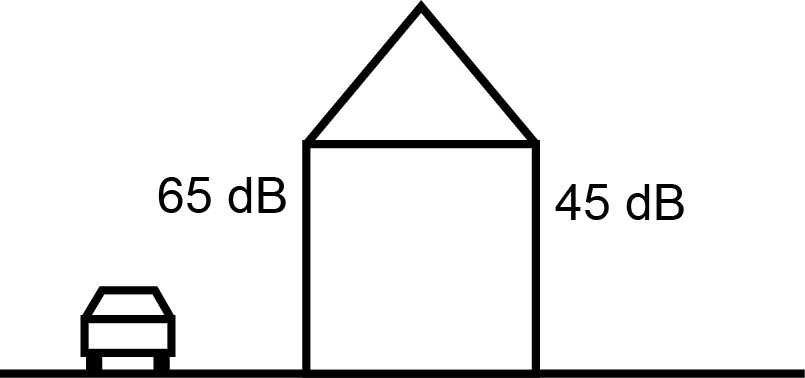
Figure 10. The Environmental Noise Directive defines a quiet façade as a façade where the day-evening-night noise level is 20 dB lower than the level on the ‘noisy’ façade.
The EU document ‘Environmental Noise Directive’ defines a quiet façade as a façade where the traffic noise level is 20 dB lower than the level on the ‘noisy’ façade of the dwelling. In other words, the difference between the highest façade level and the lowest façade level of a dwelling is used to define a quiet façade. Recent investigations indicate that it is better to define a quiet façade by the level on the quiet façade only. There may be beneficial quiet-façade effects also for level differences smaller than 20 dB, for example for a highest façade level of 60 dB and a lowest façade level of 45 dB.
In addition to limiting the equivalent night level Lnight, we also
recommend that cities reduce chances of high peak levels during the
night at the quiet façade. This can be done by avoiding
situations with roads located directly on quiet façades. Quiet
façades should preferably be located adjacent to ‘urban areas
without direct traffic-noise exposure’, such as (semi-)closed
courtyards. This is illustrated below. In this context it is
interesting to note that the
WHO Guidelines for community noise recommends that, “for a good
night’s sleep”, individual noise events with maximum levels exceeding
45 dB should be avoided.
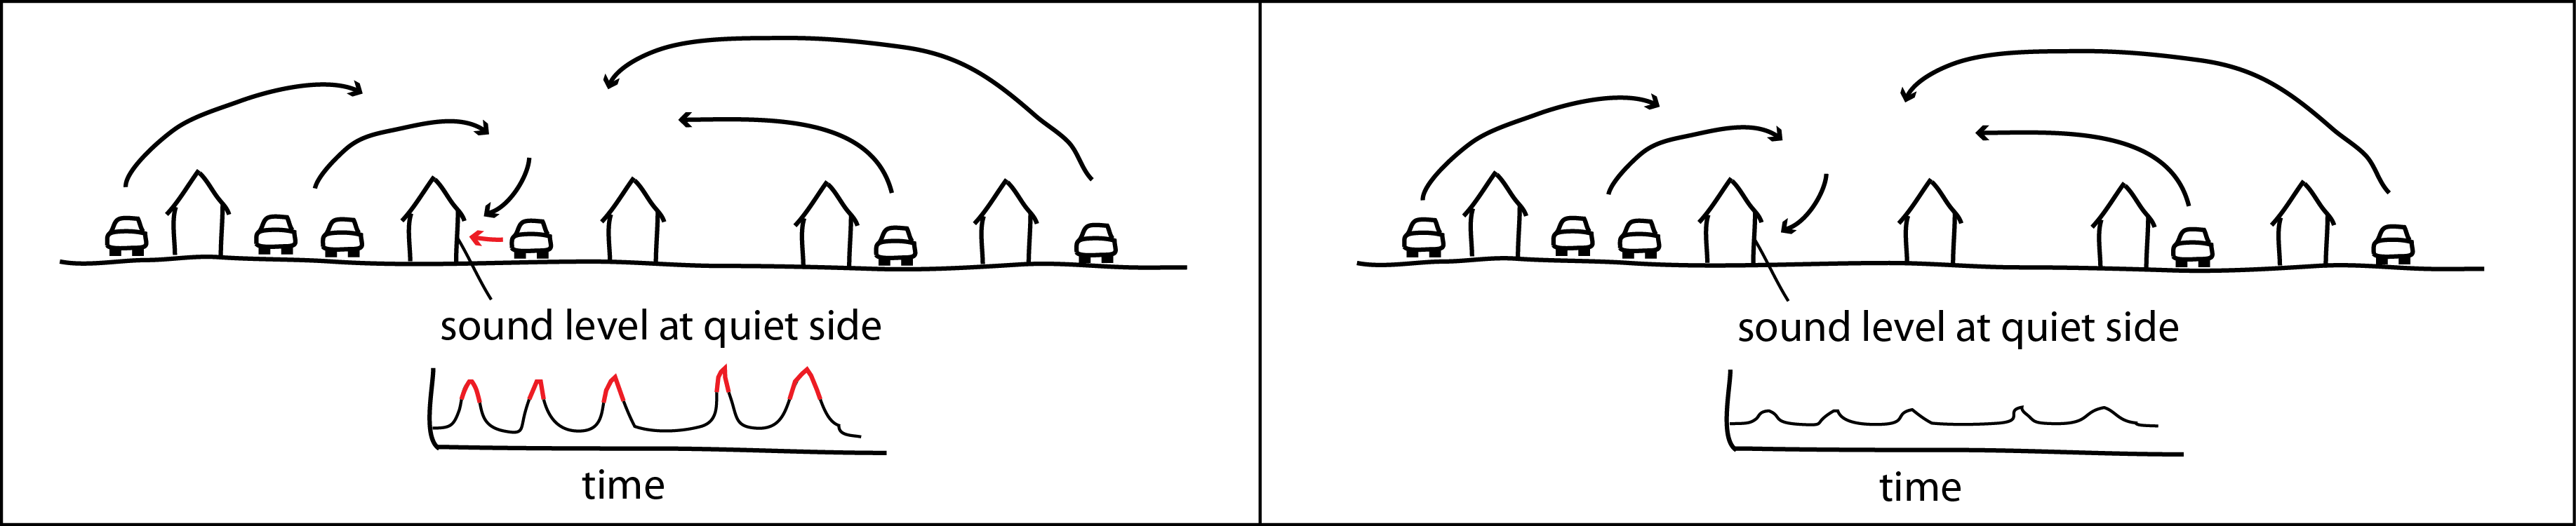
Figure 11. Situations with direct traffic-noise exposure of quiet façades (left) should preferably be avoided, since passing cars cause maximum indoor levels that may cause sleep disturbance. In situations with only indirect traffic noise exposure (right), there are less high peaks on the quiet façade, so inhabitants have the possibility to sleep on this side without traffic-noise disturbance.