What is a quiet place?
A quiet outdoor area implies a pleasant soundscape where people enjoy staying for a while. Traffic noise should not dominate the area/soundscape and one can hear pleasant natural or man-made sounds. A quiet area is never entirely characterized by just sound levels as other qualities are important too. Even though people seek tranquillity, they also want a safe and clean place and a pleasant view, preferably with green or water. Most people prefer a traffic noise level below 45 dB Lday and would not accept a level over 55 dB Lday.
City noise
Road traffic sound is the dominant and most constant source of noise in the urban environment. Sounds from rail and air traffic and industry may be important too, but these are less ubiquitous as they are important only in the vicinity of railway lines and yards, air routes and airports, and noisy enterprises.
There are other sound sources in the urban environment, but they are not part of the European Noise Directive (END) that considers only transportation and industrial sources and their impact on residents being at home. Surveys in the four most populated cities in the Netherlands show that the most annoying noise sources for residents are scooters/mopeds and neighbours, followed by city road traffic and construction and demolition sites. As scooters/mopeds are usually not part of the assessment of road traffic noise levels, three out of the four most annoying noise sources in these cities are not addressed in the END. Even this conclusion is incomplete because the surveys do not address all noisy sources. E.g. noise from pubs or leisure activities is often not mentioned in surveys. From the Amsterdam quiet areas project we know that people in the street are an important nuisance, probably belonging to the top 5 in noise annoyance.
But sounds are not just a nuisance. At home in a city also rustling trees, chirping birds, the chatter of passersby and playing children, music, and even the background of cars, trams, pedestrians, cyclists, and perhaps trains or arcraft may be heard: sounds that we usually like, though probably not at all times. Sometimes people enjoy the bustle of the city, special events in town or something ‘happening’ in the neighbourhood.
It is not well known how noise is evaluated when being outdoors. It is evident from most studies that visual and acoustical properties are important with respect to tranquillity or quietness. Generally natural sounds are preferred and mechanical sounds are least appreciated. In cities traffic noise is apparently tolerated to some degree when being outdoors. Pleasant sounds in an urban environment are predominantly natural sounds (wind, water, animals and other nature) and music (most of this voices and ‘unplugged’ music), followed by people; least pleasant sounds are traffic and other mechanical sounds (machines, building, drills, lawn mowers, sirens).
The acoustic environment is a major factor influencing the overall comfort in an urban open public space. Acoustic comfort is closely linked to the visual impression of the space. For a comfortable acoustic environment it is important to reduce the background noise level. For pleasant sounds (music, water) the relationship between acoustic comfort and sound level is weaker than for noise from traffic or demolition. In Amsterdam several factors were investigated that could influence the need for quietness for Amsterdam residents. It was found that sounds with negative associations (noise) were related to an increase in this need, whereas sounds with a positive connotation (liveliness) were related to a decrease in the need for quietness.
What is a quiet façade?
A quiet façade serves two aims. One is that it enables residents to sleep with their window open without being disturbed by noise. Second is that it enables residents to leave a window open or enjoy the outdoor garden or balcony at that façade without undue disturbance from noise. Therefore, a dwelling has a quiet façade when there is no noise on that side of the house. Although it is that simple, this raises the point what it means ‘there is no noise’. In relation to a quiet façade we often mean this in relation to a specific noise. Most probably this is road traffic noise, but it could also be noise from trains, aircraft or industry. Of course people in the street, a shop or pub, or neighbours can also cause noise, but this is usually not taken into account when considering a quiet façade because it is not mechanical noise. These latter sounds are not constantly present and are not always perceived as noise, but also they are often not easy to control.
The END addresses transportation and industrial noise. It defines a quiet façade as having a relatively low noise exposure: at least 20 dB below the most exposed façade. This implies a high level at the most exposed side, as in many urban areas daytime sound levels almost everywhere will usually be above 40 dB(A). So a quiet façade according to the END is perhaps not absolutely free from noise, but the noise level is much lower than on the other side. Other guideline or limit values for a quiet façade are based on absolute values on the noise level, such as 50 dB(A). In this case too a quiet façade may not be absolutely free from noise, but most people will not be annoyed because the noise level is sufficiently low. In the QSIDE project several cities have been interviewed about their current approach with respect to quiet façade, and it was found that all cities but one that we have consulted used a definition based on an absolute level (see Table below).
Adverse effects of road traffic noise may occur above levels of or equivalent to 42 (no severe annoyance) to 48 dB (‘residential area good and healthy’) Lden. Where limits for (quiet) façades in urban residential areas have been established, the limit value varies between 48 (Gothenburg) to 58 dB (Hamburg) Lden. Other cities (Amsterdam, Utrecht, Helsinki) have limits or a stricter applied limit (Gothenburg) in between at values of 50 to 57 dB Lden. The WHO guideline values for the most exposed façade are equivalent to 52 to 57 dB Lden and set to a value below which a majority of the population will not be (moderately or seriously, respectively) annoyed. The WHO gives a limit for the night-time noise level of 40 dB Lnight, but in countries where 40 dB cannot be achieved in the short term an interim value of 55 dB Lnight is recommended as part of a stepwise approach.
| City | Status of | Definition of quiet façade |
|---|---|---|
| quiet façade | ||
| Amsterdam | existing policy | < standard limits, i.e. < 48 dB Lden road < 55 dB rail, < 50 dB industrial |
| Gothenburg | existing policy for city center | preferably < 45 dB LAEq,24h, < 50 dB obligatory |
| Brussels | not enforced, assessment only | quiet side < noisy side - 20 dB |
| Hamburg | existing policy | < 49 dB Lnight in residential, < 54 in mixed areas, in new buildings living rooms and bedrooms must be situated at quiet (noise averted) side |
| Helsinki | recommendation | < standard limit, i.e. 55 dBA Leq7-22; 50 dBA Leq22-7 on façade and garden/balcony |
| Utrecht | existing policy | see Amsterdam |
| Zurich | existing policy | < standard limits |
Based on the results of a literature search and the results of the Qside project, we recommend that the least exposed façade of a dwelling is a quiet façade (with respect to road traffic noise) if:
- the noise level is preferably limited to 45 dB Lden;
- the noise level is not higher than 50 dB Lden;
To enjoy the outdoor space at the quiet façade it must have sufficient quality; e.g. a garden or park is better than a parking lot. A higher quality of the outdoor living area at the quiet side can increase the effect of the quiet façade.
A quiet night time façade should preferably comply with the WHO night noise guideline value of 40 dB and not exceed 45 dB Lnight. These Lnight values will often correspond to noise classes 46-50 and 51-55 dB Lden, respectively, so the recommendations for Lden usually imply sufficiently low night time levels. The WHO interim value of 55 dB Lnight is too high to warrant a quiet façade.
In addition to limiting the equivalent night level Lnight,
we also recommend that cities reduce chances of high peak levels
during the night at the quiet façade. This can be done by
avoiding situations with roads located directly on quiet
façades. Quiet façades should preferably be located
adjacent to ‘urban areas without direct traffic-noise exposure’, such
as (semi-)closed courtyards. This is illustrated below.
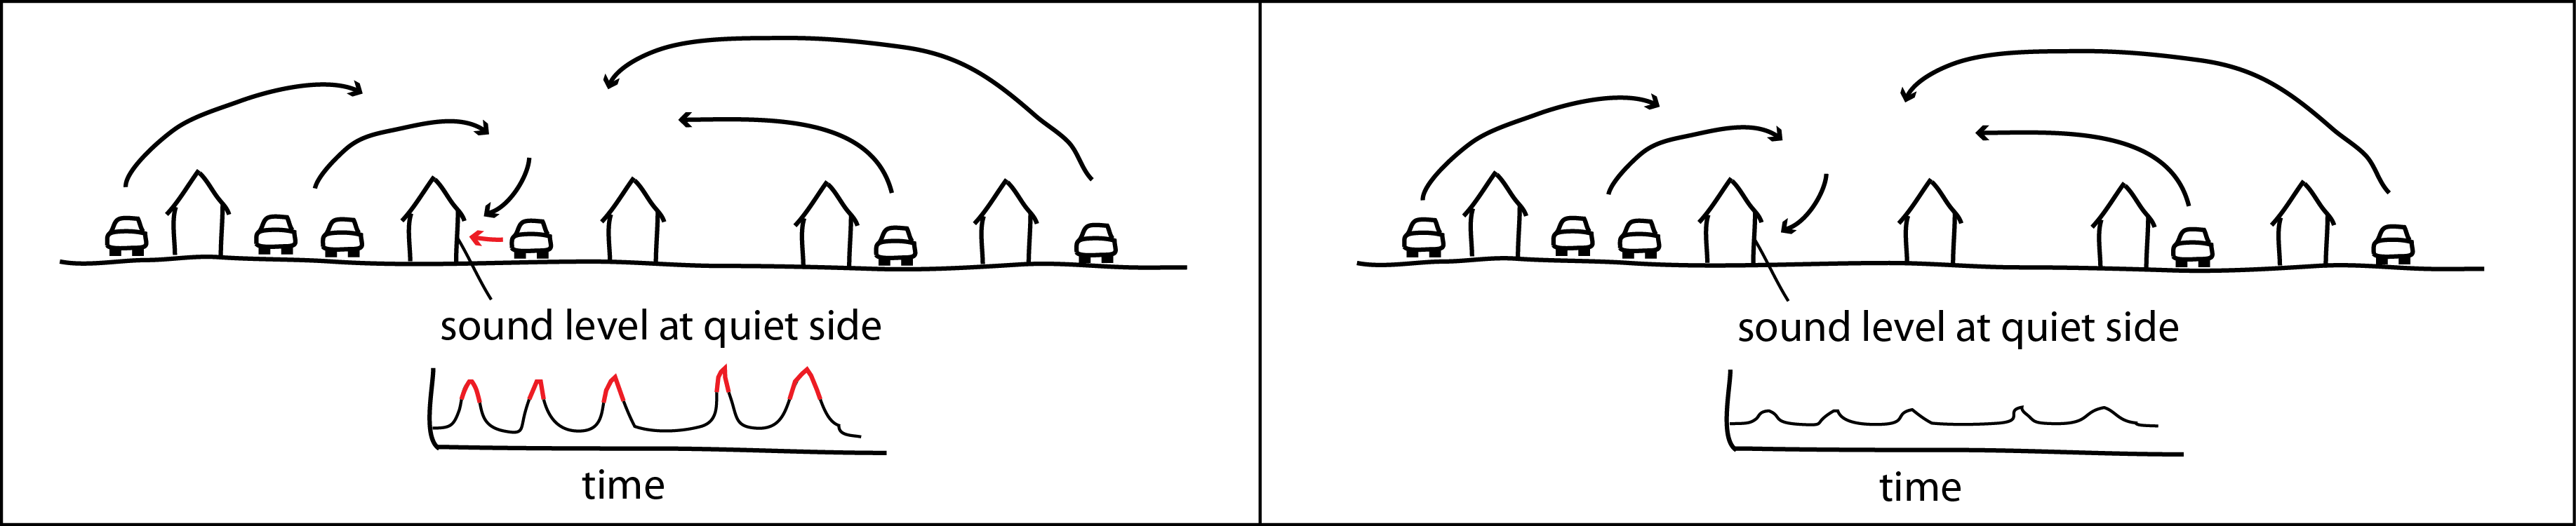
Figure 1. Situations with direct traffic-noise exposure of quiet façades (left) should preferably be avoided, since passing cars cause maximum indoor levels that may cause sleep disturbance. In situations with only indirect traffic noise exposure (right), there are less high peaks on the quiet façade, so inhabitants have the possibility to sleep on this side without traffic-noise disturbance.
The noise levels should be established at a height of 4 m in front of the façade to comply with the END. Only incident sound (excluding façade reflection) must be measured or calculated. For other noise sources there is less information available. Considering the different abilities of different noise sources to increase the risk of annoyance, the limits for industrial noise can probably be similar to the proposed values, though for rail traffic they could be somewhat higher, for aircraft noise they should be lower.
What is a quiet area?
What we mean by quiet area here is an outdoor space, including a pleasant soundscape, where people enjoy staying for a while. Levels of traffic (or other) noise should be low enough to not dominate the space/soundscape, and there are bound to be pleasant natural or man-made sounds. The level and type of sounds depend on the need to be fulfilled in that space: is it for play or exercise without too much traffic noise or a tranquil place to rest and relax? For example: a restaurant square can be lively and pleasant and can be thought of as quiet because of the absence of dominant mechanical sounds, but it is not a place to sit alone and enjoy nature. Those that really want to enjoy peace and quiet probably prefer a greener place and not so many people around. A quiet area is never entirely characterized by just sound levels as other qualities are important too. Even though people seek the quietness, they also want a safe and clean place and a pleasant view, preferably with green or water.
Apart from those other qualities, there are two ways to characterize an urban place acoustically as quiet. One is that noisy sounds should be either so soft that they are not intrusive or last only for a short time so there is quietness in between the noises. This description best matches the ability of most people to allow for some noise. A problem in this approach is that usually we have no information on the time that noises that stand out from the background are (clearly) audible. The other way is a more conventional acoustic criterion: an area is (sufficiently) quiet if the noise level is below a limit. This level can be Lday, as we usually enjoy the outdoors at daytime, but it could (also) be Levening if the place is important for leisure after work.
The first approach has been proposed in the Netherlands and Sweden. The Swedish proposal included tolerable levels of noise in urban areas of 45 to 50 dB Lday (or 10 to 20 dB below the level of surrounding streets). The second approach has been recommended or applied in a number of countries: in nearly all cases the limit was (equivalent to) 45 tot 55 dB Lday, but a value of 40 to 45 dB was also mentioned (mentioning 40 dB as a ‘gold standard’). In two of the twelve cities we consulted, quiet areas are defined using acoustic criteria, though as yet these are only recommendations. In Brussels this is based on Lden (≤ 55 dB), in Helsinki on Leq,7-22h (≤50 dBA) and Leq,22-7h (= Lnight, ≤45 dBA). In the Amsterdam quiet areas study Lday or Lden (≤ 55 dB) has been proposed. In Brussels and Amsterdam also non-acoustic criteria are mentioned, in Oslo only non-acoustic criteria.
Adverse effects have been shown to occur above 57 dB(A): people then became annoyed when making a city walk, severely annoyed above 62 dB(A). For comparison: when dwellings are exposed to 60 dB Lden, 10% of the inhabitants report a high degree of annoyance when being indoors. In the Amsterdam quiet areas project respondents mentioned a number of small and large quiet places, none of them with a traffic noise level at their centre above 60 dB Lday. There could be a preference for a low noise level (36-40 dB), but this depended very much on the popularity of two areas and probably less because of the low noise level. Apart from that, areas with a (central) traffic noise level between 45 and 55 dB Lday were most prevalent in the survey results.
Based on all these results, our recommendation for a quiet area (with respect to road traffic noise) is:
- the level in that area is not higher than the level in the surrounding area;
- the noise level in (the central part) of the area is preferably limited to 45 dB Lday;
- the noise level in (the central part) of the area is not higher than 55 dB Lday;
If an area is meant for rest and relaxation or the experience of quietness the level must be as low as possible, but certainly below 45 dB. In busy urban areas this is often not achievable, but one should aim for 50 dB. The high limit of 55 dB could be appropriate for an area of active urban recreation without a specific demand for tranquillity.
To enjoy the area it must have sufficient quality with respect to use, view, cleanliness and safety. A higher quality of the area can increase the effect of the peace and quiet.
The noise levels should be established at a height of 1.5 m (approximately ear height) which is the minimum measurement height according to the END.
What is outdoor quality?
The recommendations for quiet façades and areas included the ‘quality’ of the outdoor area. But what is that quality? In general the quality of a public city space is about the appreciation of that space because of physical and social characteristics. This can be divided in, e.g., architectural and natural qualities, and a perception of pleasant socializing and safety. But it is hard to pin down what exactly determines urban quality. According to one writer
"the quality of urban design is the product of the conscious and unconscious design decisions of many different interests and individuals. Urban designers have difficulty defining urban design and agreeing what constitutes good urban design amongst themselves; consider, then, the problem of defining and discussing quality of urban design with unselfconscious urban designers!"
Quality includes people's perceptions and experiences of a development or area, the image and 'feel' of areas, the legibility of localities, the opportunities to discover and learn in an environment and the degree of freedom of access and action. Complexity, surprise, diversity of activities and users, vitality, a sense of time and historical continuity are important factors, but this yet leaves to be decided how to determine this objectively or how to implement this in practice. Based on images of commercial streets five properties could explain most of the perceived quality: imageability, enclosure, human scale, transparency and complexity. These properties consist mostly of objective quantities; imageability for example is defined by the number of people, the proportion of historic buildings, the number of courtyards/plazas/parks, the presence of outdoor dining possibilities, the number of buildings with non-rectangular silhouettes, noise level, number of major landscape features and number of special buildings (‘with identifiers’). These quantities are not readily available; they can be counted or measured but they are not absolute data as they depend on perception from a certain position.
It has already been mentioned that people usually view natural sounds as pleasant and proper to a quiet place. In Amsterdam over 75% of respondents thought the presence of green or water, quiet/tranquil, and well-kept/clean were important characteristics, and over 50% thought nice colours, no noise, spacious, nice sounds and nice odours were also important. In countryside areas in the UK hearing birdsong, peace and quiet, natural sounds, wildlife, running water and seeing a natural landscape or streams contributed to a feeling of tranquillity and hearing constant noise from cars, lorries, motorbikes, lots of people, and seeing lots of people, urban development, power lines or roads detracted from it. This again demonstrates that natural acoustical and visual elements contribute to tranquillity whereas artificial elements are more liable to disrupt it.
Relation between sound level indicators
In several countries or cities guideline values or limits have been proposed that are based upon different indicators such as Lden, Lday or LAeq,T (with T = 1 hour, day + evening or night). To be able to compare values it will be assumed that the night-time equivalent sound level is 6 to 10 dB lower than the daytime level, and the level at evening halfway between both. In the Netherlands Lnight is usually approximately 10 dB below Lday for city traffic and up to 6 dB below Lday for traffic on motorways (where the proportion of heavy traffic is higher at night). Given these assumptions, we can estimate:
- LAeq,24h = Lden - 3 (± 1) dB
- LAeq,7-22h = Lden - 1.5 (± 1) dB
- LAeq,22-7h = Lnight = Lden - 9 (± 1) dB
- Lday = Lden - 1 (± 1) dB
References
Information on proposed and actual noise limits in this text are taken from the Euronoise2012 paper (see below) when no other reference is mentioned.
- The END: European Commission: European Noise Directive 2002/49/EC of the European Parliament and of the Council, of 25 June 2002, relating to the assessment and management of environmental noise (2002)
- About the quiet areas project in Amsterdam: Hester Booi and Frits van den Berg: Quiet Areas and the Need for Quietness in Amsterdam, International Journal of Environmental Research and Public Health 9, 1030-1050, (2012)
- The WHO noise guidelines: B. Berglund, T. Lindvall, D.H. Schwela (ed.): Guidelines for Community Noise. World Health Organization (1999)
- An overview of proposed and actual limit values for quiet façades/areas: Frits van den Berg, Carlo Schoonebeek, Menno Hillebregt: On the definitions of quiet façades and quiet urban areas, proceedings of Eurnoise2012, Prague (2012)
- Qside report with overview of quiet façades/areas policy of selected cities: Qside Action 1 report (2011); see www.qside.se