Example 2, quiet sides in Gothenburg
By Mikael Ögren
<<< Back to examples
The video below illustrates a short walk around a block in Haga, Gothenburg. Press on the subtext button to show the sound level measured during the walk (rectagular button with two lines).
Video 1
The noise map of the area is shown in figure 1 below, and as noted in the video the level is around 10 - 15 dB noisier on the exposed side of the block. The walking path is indicated with a black line inside the building block.
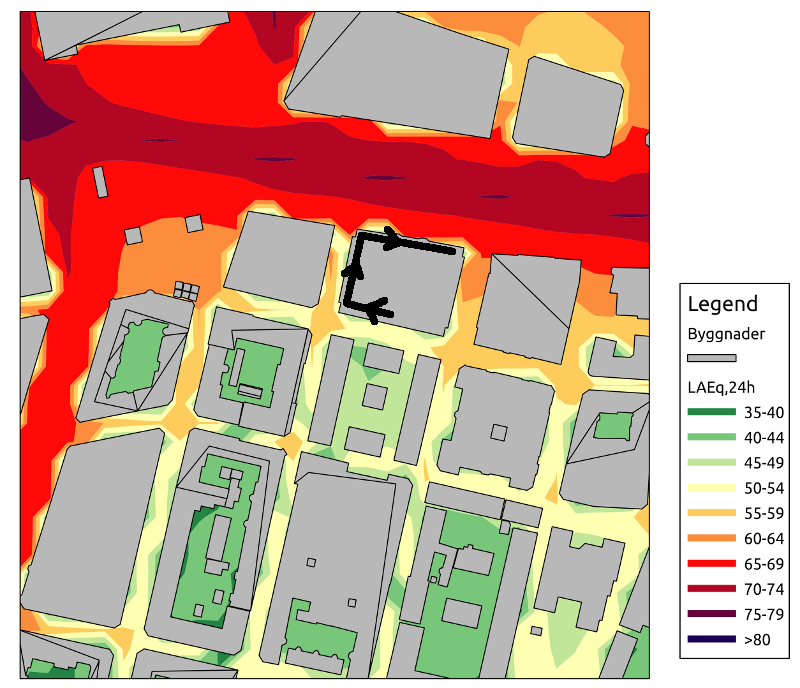
Figure 1. Traffic noise map of a part of Haga, Gothenburg.