Example 3, Amsterdam
<<< Back to examples
Figure 1 shows calculated traffic noise levels in Amsterdam. Indicated is a park in the city center, which is called Vondelpark. Calculated noise levels are about 50 dB at the boundary of the park, and lower than 50 dB well inside the park.
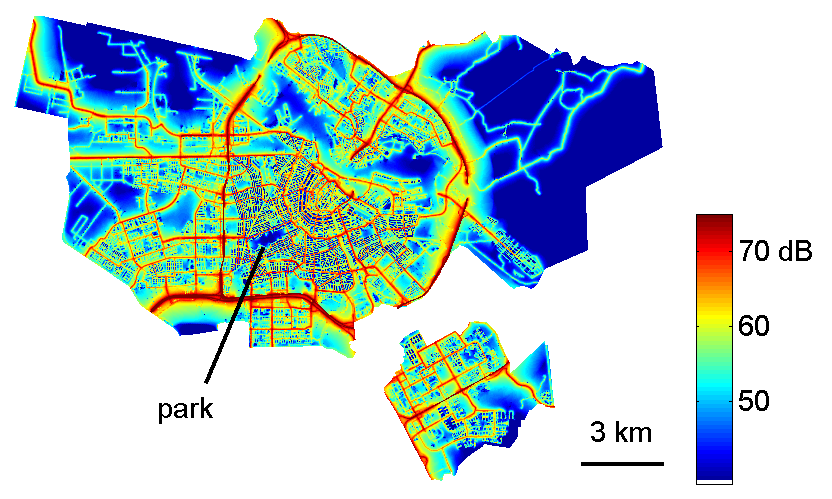
Figure 1. Calculated traffic noise map of Amsterdam. The color represents the 24h traffic noise level (day-evening-night level). Noise levels in the park are lower than in the area around the park. Note: for traffic in quiet streets with unspecified traffic volume, a volume of 20 cars per hour was assumed.
Figure 2 shows measured and calculated sound levels in streets in Amsterdam. The measurements were performed during bicycle tours on two days. Calculated levels are based on average traffic volumes for the day period. Measured levels in the Vondelpark are 50-60 dB, with contributions from nearby traffic and people in the park.
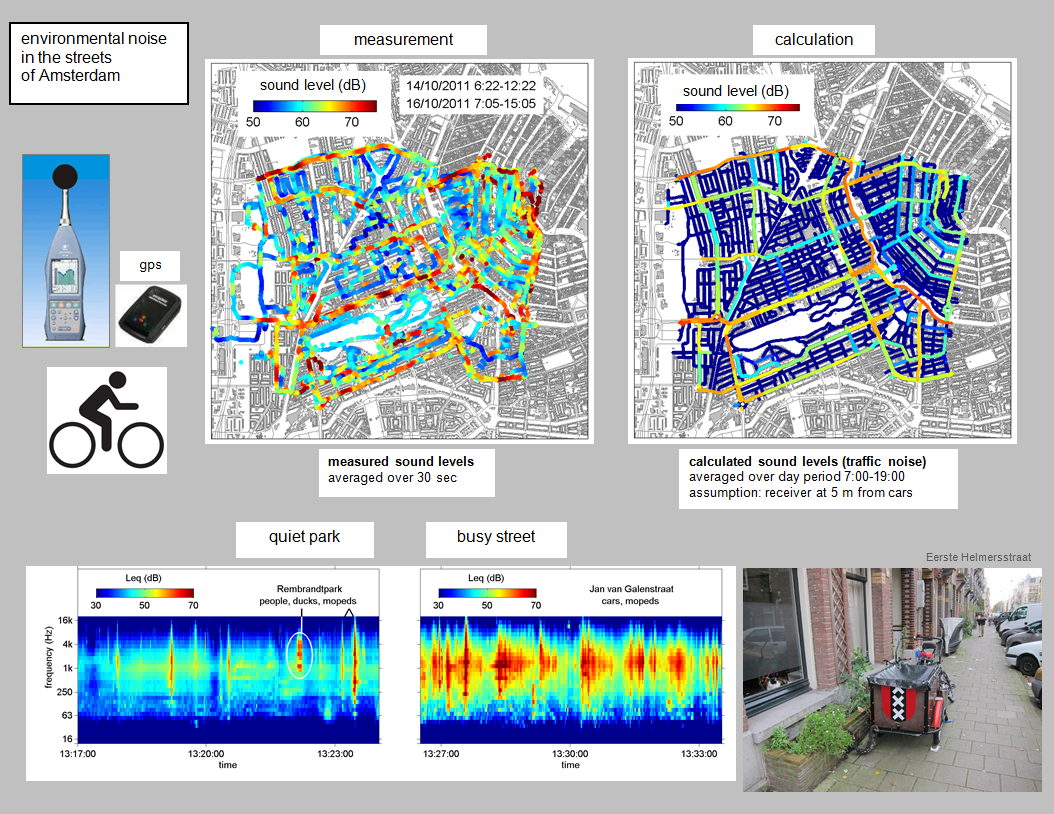
Figure 2. Measured and calculated sound levels in streets in Amsterdam. The measurements were performed during bicycle tours on two days. For the calculations, average traffic volumes for the day period were used. For quiet streets with unspecified traffic volume, a fixed level of 50 dB was assumed. Spectrograms in a park and a busy street are shown.
The results in Figs. 1 and 2 confirm the general picture: high traffic noise levels are found primarily near busy streets. The measurements confirm that sound levels are low in quiet residential areas between busy streets.
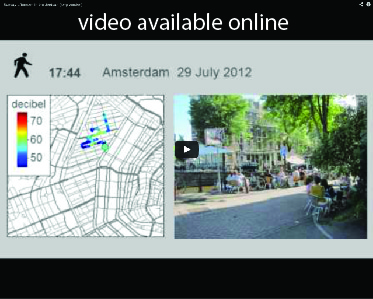
Video 1
Video 1 gives an impression of sound levels in Amsterdam, with
- 70 - 80 dB in busy streets
- 50 - 60 dB in quiet areas (park, quiet residential area).
Video 2
Video 2 gives an impression of sound levels in the Jordaan, a residential area in Amsterdam. Public courtyards in the area are very quiet, with sound levels below 50 decibel. Sound levels are a bit higher in the lively streets, where people have a drink outside at the bars. Video 3 is a short version.
Video 3